.svg)


Where to Buy
FRESHY is stocked at 218 licensed dispensaries across Oregon, New Jersey, and 3 other states, 166 of them in Oregon, with the deepest coverage in Portland, Eugene, Bend, Klamath Falls, and Medford. Search by ZIP code or city below to find the closest one, or filter by product type if you are after a specific format.
Market Insights Snapshot
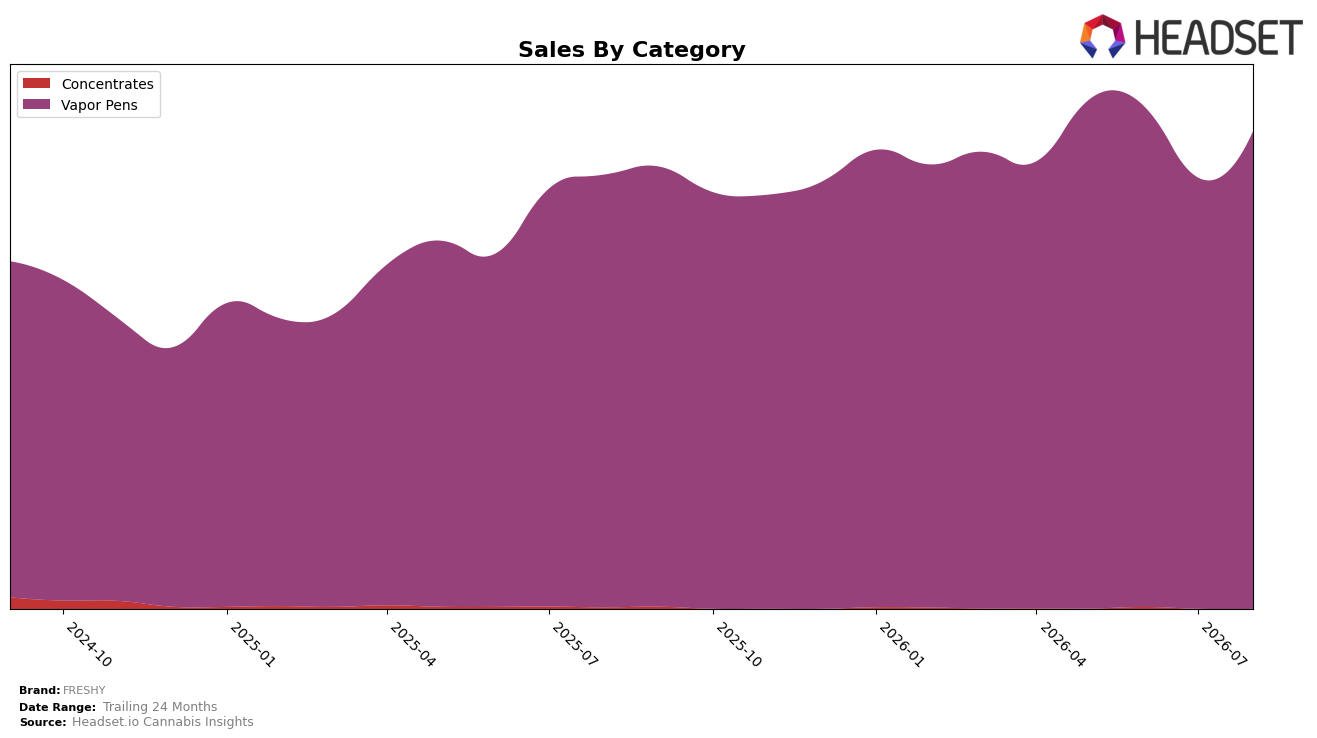
FRESHY concentrated entirely in Vapor Pens during August 2026, with category share at 100.0% and average price of $16.29, while sales in Vapor Pens rose 10.59% year over year and 11.01% month over month. Brand-level sales grew 10.20% year over year alongside a 1.99% average price decline, placing FRESHY at rank 5 in Oregon for Vapor Pens. The pattern implies the brand is leaning on volume gains within a single-category footprint, trading a 1.99% price dip for double-digit growth that keeps it anchored to a top-5 state-category rank.
With no diversification beyond Vapor Pens and a rank of 5 in Oregon, the dual lift of 10.59% year-over-year and 11.01% month-over-month signals a positioning that prioritizes share capture through pricing elasticity rather than mix expansion. The -1.99% pricing move paired with a 19.31% two-year sales increase suggests FRESHY’s competitive posture hinges on sustaining mid-tier rank via velocity, not portfolio breadth, implying continued exposure to category-specific swings but headroom to climb if price-volume tradeoffs keep converting at an 11.01% monthly pace.
Competitive Landscape
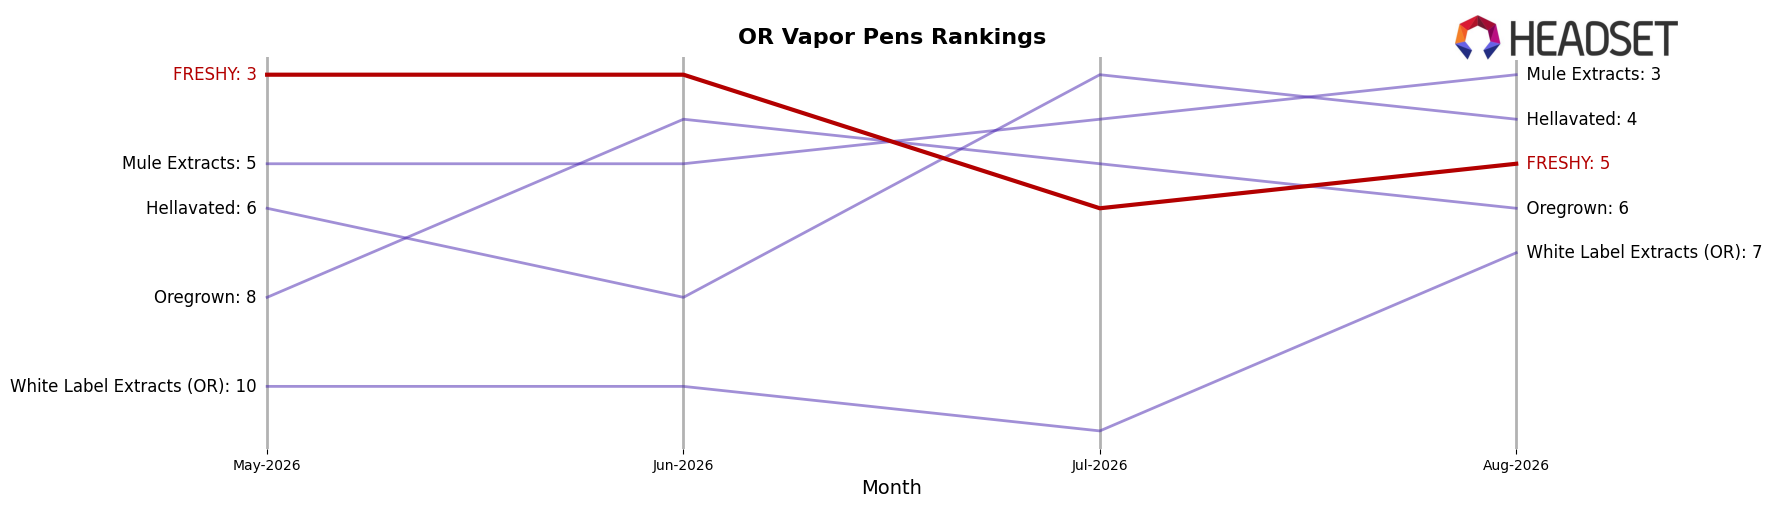
FRESHY sits at rank #5 in OR Vapor Pens in August 2026, unchanged YoY from #5, after sliding 2 positions from #3 in May–June to #5 by August and ceding its peak rank of #3 reached in June 2026; meanwhile, Buddies moved from #2 to #1 YoY with a 3.17% sales lift, and Entourage Cannabis / CBDiscovery fell from #1 to #2 YoY with a 24.50% sales decline, indicating that FRESHY’s flat YoY rank alongside a 2-spot drop since June 2026 implies share is being compressed by top-tier churn rather than broad market softness.
Notable Products
Boysenberry Jam Live Resin Cartridge (1g) posted the steepest decline at -11.6% month over month while holding rank 5, contrasted with Watermelon Splash Flavored Live Resin Disposable (1g) up 23.8% at rank 6, which narrows the performance gap between mid-pack SKUs. Blueberry Burst Live Resin Disposable (1g) led at rank 1 with $52,924 in August 2026 while Tiger's Blood Live Resin Cartridge (1g) slipped -1.8% at a rank-2 tie, indicating that momentum is tilting toward disposables at the very top. With Vapor Pens occupying 10 of the top 10, and two of the top three slots held by disposables, the mix implies FRESHY is shifting demand toward flavored disposable formats that can absorb minor cartridge softness without losing category rank.
Top Selling Cannabis Brands






Data for this report comes from real-time sales reporting by participating cannabis retailers via their point-of-sale systems, which are linked up with Headset’s business intelligence software. Headset’s data is very reliable, as it comes digitally direct from our partner retailers. However, the potential does exist for misreporting in the instance of duplicates, incorrectly classified products, inaccurate entry of products into point-of-sale systems, or even simple human error at the point of purchase. Thus, there is a slight margin of error to consider. Brands listed on this page are ranked in the top twenty within the market and product category by total retail sales volume.

