May-2026
Sales
Trend
6-Month
Product Count
SKUs
Avg Price
YoY Sales Change
YoY Price Change
Market Insights Snapshot
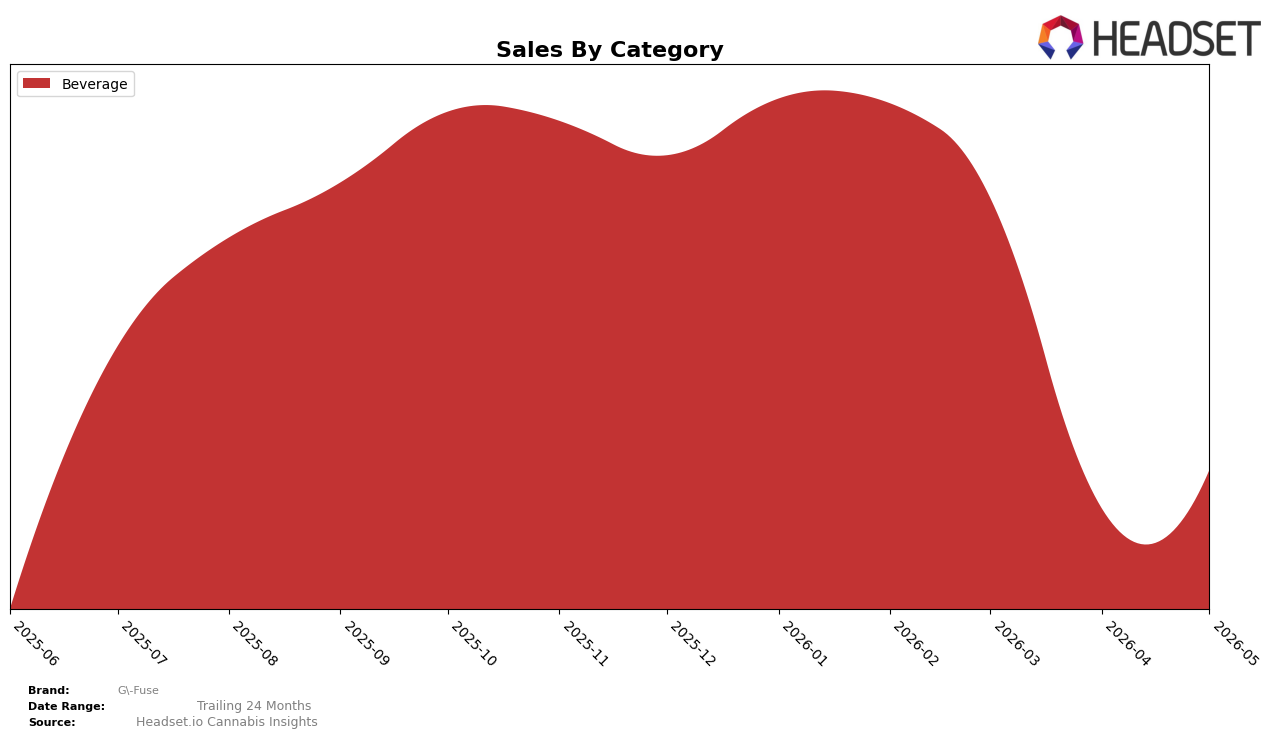
In May 2026, G-Fuse operated as a single-category brand with Beverage at 100.0% category share, indicating no internal mix diversification; within that sole category, month-over-month sales moved 32.83% while average price sat at $16.14, creating a volume-led step-up rather than a price-led lift. With year-over-year metrics unavailable, the 32.83% MoM change serves as the primary directional signal, and the absence of a recorded rank in New Jersey alongside a 100.0% category concentration implies that recent momentum is tied to a narrow but accelerating Beverage footprint.
The consolidation in Beverage (100.0% share) combined with a 32.83% MoM upswing points to a positioning that leans into depth over breadth, trading potential cross-category resilience for tighter execution within a single format; this setup raises sensitivity to Beverage-specific demand cycles while reducing dilution from slower adjacent categories. With no listed rank in New Jersey and no YoY benchmark, the May 2026 pattern suggests G-Fuse is prioritizing penetration within Beverage rather than portfolio expansion, which could amplify gains when Beverage trends rise but also magnify exposure if category momentum cools.
Competitive Landscape
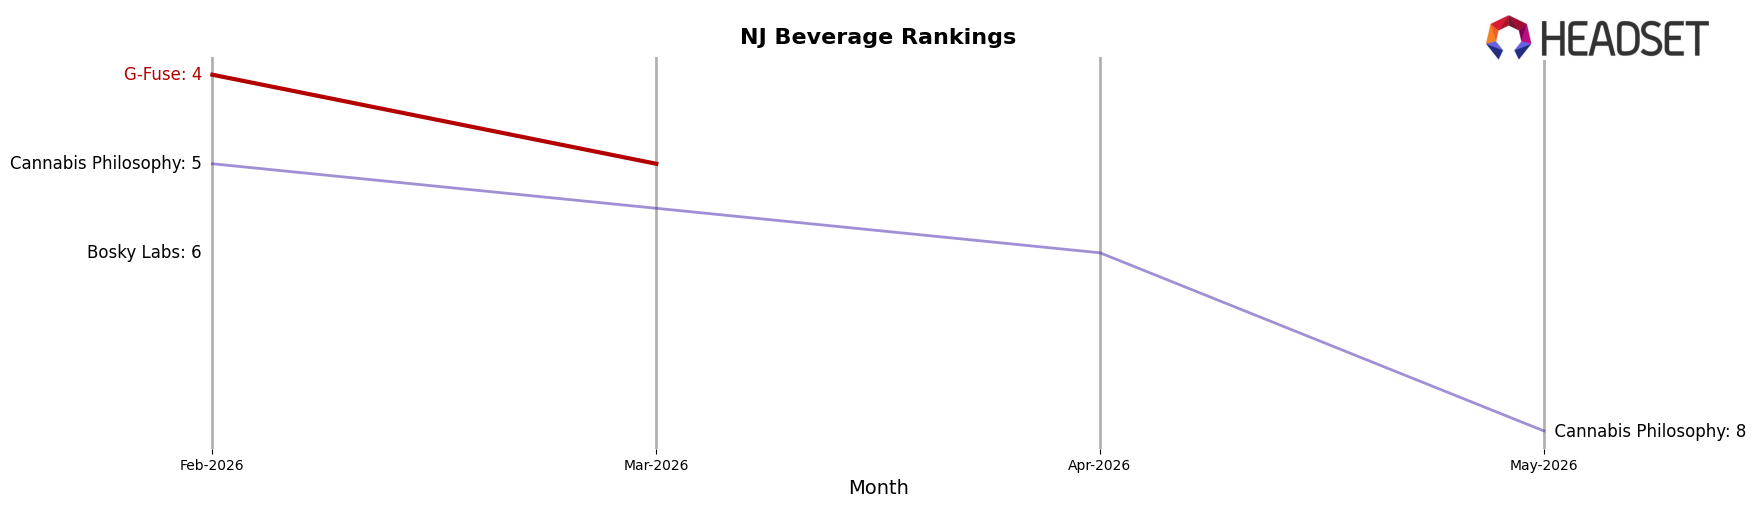
G-Fuse sits at #9 in NJ Beverage in May 2026, down 5 positions from #4 in February 2026 and 5 positions from #4 in March 2026, signaling a rapid retreat from its recent peak; meanwhile, Journeyman climbed from #3 to #1 year over year while expanding sales by 530.4%, and Major held #2 year over year despite a 41.4% sales decline, indicating competitors are either accelerating or holding ground as G-Fuse slides. With Zero Proof moving up 1 rank year over year to #5 even as sales fell 89.7%, the rank gap from G-Fuse at #9 to prior peak #4 suggests share is being redistributed rather than the category lifting all brands, implying G-Fuse’s trajectory points to lost shelf presence unless rank stabilizes or reverses.
Notable Products
Chill Tropical Splash Liquid Syrup (100mg THC, 120ml, 4oz) posted the standout move with a 177.5% month-over-month surge to rank 2, outpacing Focus Berry Blast Syrup (100mg THC, 4oz, 120ml) at rank 1 with an 80.4% lift; meanwhile, Unflavored Culinary Syrup (100mg THC, 4oz, 120ml) slid 48.9% to rank 4, and Purple Reign Syrup (100mg THC, 2oz, 60ml) declined 24.7% at rank 5. Three of the top five are flavored beverage syrups, concentrating demand in fruit-forward SKUs while Extreme Citrus Bliss Syrup (100mg, 4oz, 120ml) held rank 3 with a modest 10.7% gain and a single unflavored option contracted sharply. The mix, with one SKU up 177.5% and another down 48.9% alongside rank 1–3 dominance by flavored beverage formats, implies G-Fuse is pivoting toward flavor-led syrups as the commercial engine over utility-driven bases.
Top Selling Cannabis Brands
Data for this report comes from real-time sales reporting by participating cannabis retailers via their point-of-sale systems, which are linked up with Headset’s business intelligence software. Headset’s data is very reliable, as it comes digitally direct from our partner retailers. However, the potential does exist for misreporting in the instance of duplicates, incorrectly classified products, inaccurate entry of products into point-of-sale systems, or even simple human error at the point of purchase. Thus, there is a slight margin of error to consider. Brands listed on this page are ranked in the top twenty within the market and product category by total retail sales volume.

