.svg)

Aug-2026
Sales
Trend
6-Month
Product Count
SKUs
Avg Price
YoY Sales Change
YoY Price Change


Market Insights Snapshot
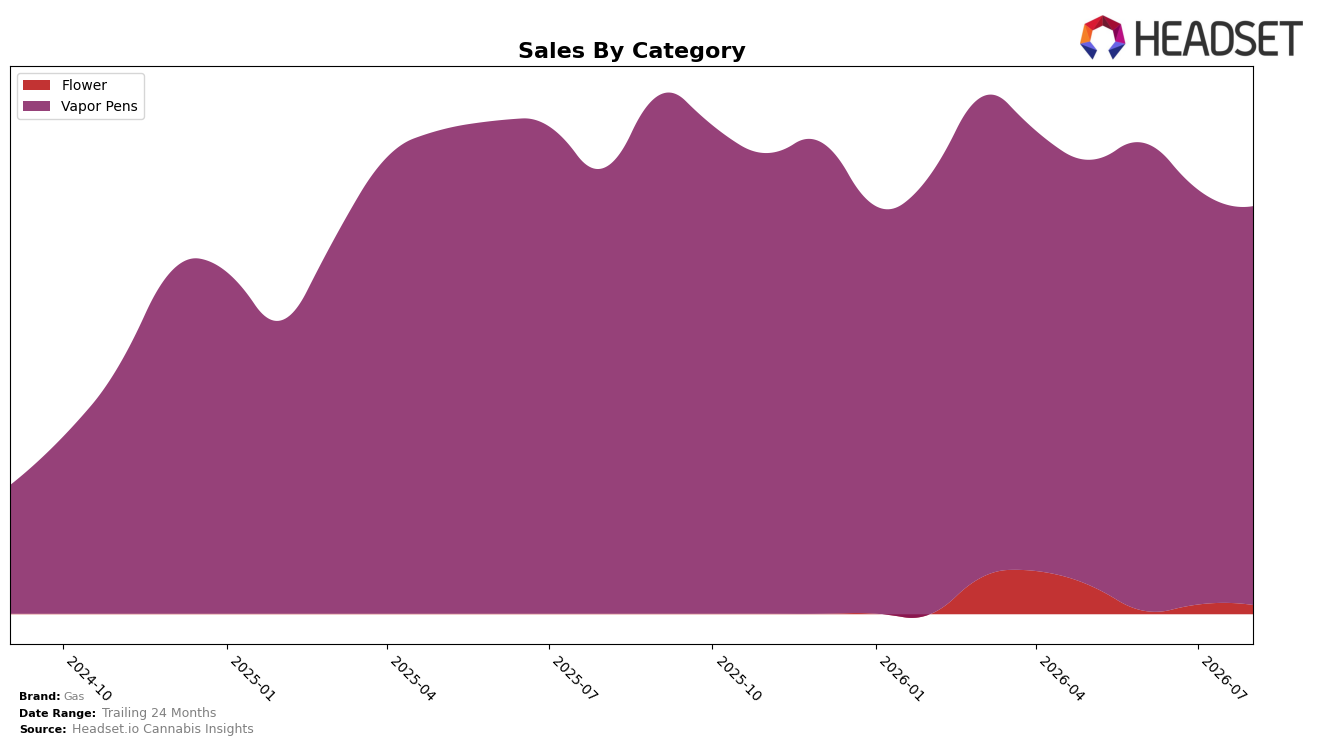
In August 2026, Vapor Pens accounted for 97.84% share while Flower held 2.16%, with Vapor Pens down 10.57% year over year and 3.89% month over month, and Flower down 4.74% month over month; this mix coincided with a brand-level sales change of -8.60% year over year and a 2.70% decline in average price. With Vapor Pens average price at $35.61 versus Flower at $48.24, the concentration in a category experiencing double-digit YoY contraction and MoM softness implies that overall performance is leveraged to Vapor Pens volatility and price-led pressure rather than diversification.
The 97.84% reliance on Vapor Pens alongside a rank of 34 in Vapor Pens in Alberta and a 3.89% MoM decline signals vulnerability to share loss if category momentum lags faster than the total market, while the 2.16% allocation to Flower and its 4.74% MoM dip offer limited offset. Given the -10.57% YoY trend in Vapor Pens against a -8.60% brand-level YoY decline and a 2.70% average price decrease, positioning skews toward defending share within Vapor Pens through price-pack architecture rather than expanding into Flower, where the higher $48.24 price and small base constrain near-term mix uplift.
Competitive Landscape
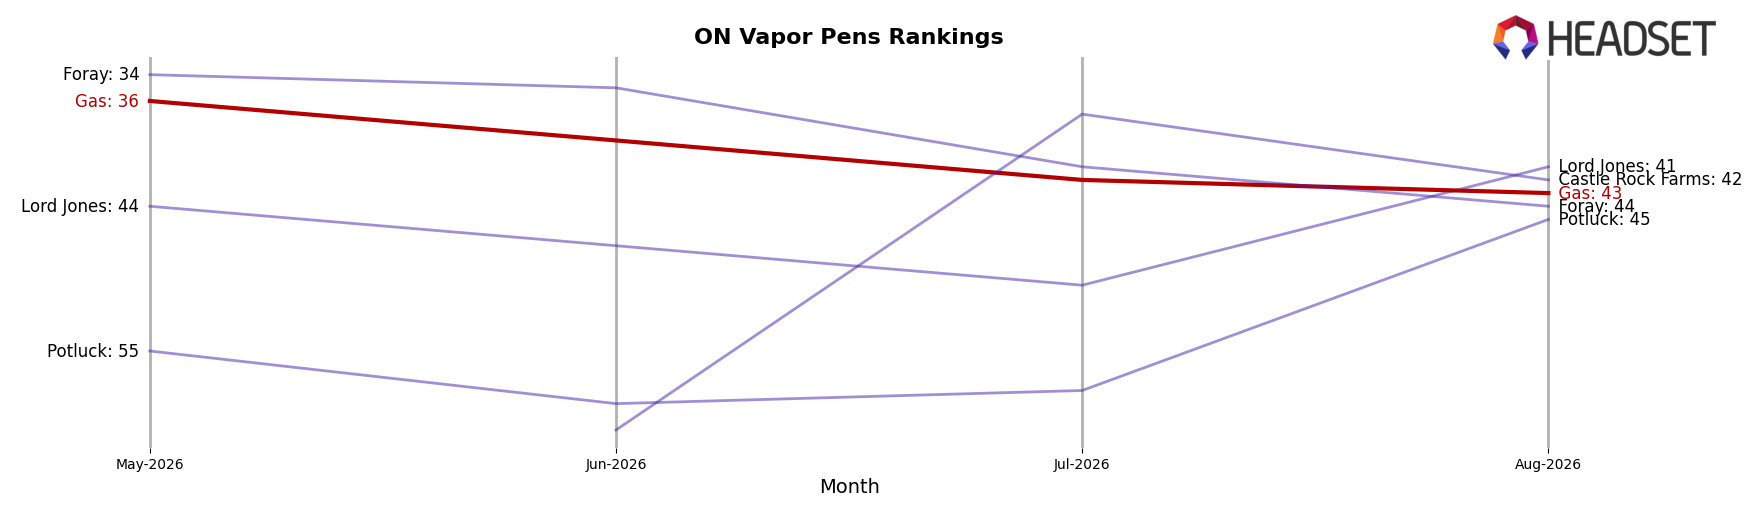
Gas sits at rank #43 in ON Vapor Pens in August 2026, down 9 places year over year from #34, and 7 places below its May–June quarter position of #36; the brand’s best historical mark was #33 in July 2025, putting today’s slot 10 ranks off its peak. In contrast, Spinach climbed from #4 to #1 with 152.3% YoY sales growth, while Back Forty / Back 40 Cannabis rose from #1 to #2 alongside 13.5% YoY growth, indicating category leaders are consolidating share as Gas loses relative position. With a 9-rank YoY slide and a 7-rank drop versus three months ago, the trajectory implies Gas is yielding shelf visibility to faster-advancing incumbents and needs a catalyst to reverse share drift.
Notable Products
Strawberry Lemonade Live Diamonds Disposable (1g) entered the top 10 at rank 10 in August 2026 with $3,565 while Peach Boba Distillate Cartridge (1g) fell 44% to rank 7, indicating a sharp pivot away from distillate cartridges toward novelty disposables. Blue Dream Live Resin Disposable (1g) rose 37% to rank 1 and Cherry Boba Live Resin Disposable (1g) climbed 28% to rank 8, while Strawberry Boba Live Resin Cartridge (1g) declined 37% at rank 6, pointing to a format shift that rewards live resin disposables over cartridges. Four of the top ten are Vapor Pens disposables and they occupy ranks 1, 2, 3, and 4 with MoM moves of +37%, +12%, and -0.3% alongside +4%, implying Gas is concentrating demand in disposable SKUs where flavor variety converts better than cartridge-based lines.
Top Selling Cannabis Brands






Data for this report comes from real-time sales reporting by participating cannabis retailers via their point-of-sale systems, which are linked up with Headset’s business intelligence software. Headset’s data is very reliable, as it comes digitally direct from our partner retailers. However, the potential does exist for misreporting in the instance of duplicates, incorrectly classified products, inaccurate entry of products into point-of-sale systems, or even simple human error at the point of purchase. Thus, there is a slight margin of error to consider. Brands listed on this page are ranked in the top twenty within the market and product category by total retail sales volume.

