Jun-2026
Sales
Trend
6-Month
Product Count
SKUs
Avg Price
YoY Sales Change
YoY Price Change
Market Insights Snapshot
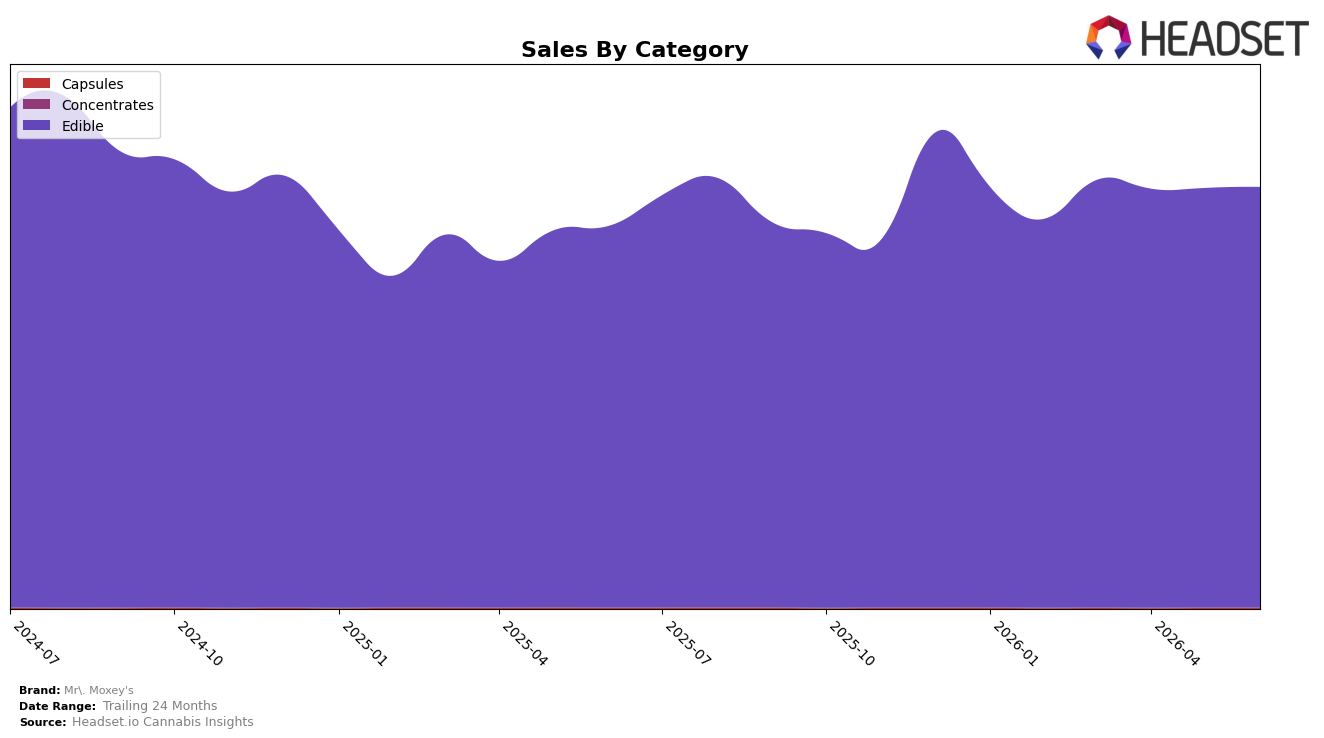
Edible now accounts for 99.87% share with June 2026 Edible sales up 10.25% year over year and 0.24% month over month, while the small Capsules line holds 0.13% share with 9.30% year-over-year growth and a 9.55% month-over-month increase. Average price in June 2026 is $17.88 with a 0.40% year-over-year uptick, aligning with Edible’s $17.88 average and contrasting with Capsules at $16.90; the mix therefore tilts further toward Edible, but Capsules’ faster 9.55% month-over-month pace versus Edible’s 0.24% suggests early-stage diversification that could incrementally lift total growth above the brand’s 10.25% Edible year-over-year run rate.
With an Edible category rank of 11 in Colorado, the 0.24% month-over-month expansion in the core Edible line offers limited rank mobility compared with what a 9.55% month-over-month Capsules surge could contribute if scaled, and the 10.25% Edible year-over-year growth versus 9.30% in Capsules indicates that near-term volume still depends on Edible velocity. This mix implies a positioning anchored in premium-priced Edibles (0.40% price increase year over year at $17.88) where incremental share gains are harder at rank 11, so leaning into Capsules’ higher month-over-month momentum while protecting Edible price could create a two-speed strategy that widens the addressable base without eroding the Edible-led price umbrella.
Competitive Landscape
Mr. Moxey's sits at rank 11 in Colorado Edible for June 2026, up 2 positions from rank 13 year over year, while holding flat versus March 2026 at rank 11; the brand’s peak was rank 10 in August 2025, a 1-position better standing than today. Among leaders, Wyld held rank 1 year over year with a -16.6% sales change, and Wana stayed at rank 2 with a -0.5% sales change, whereas Dialed In Gummies remained rank 3 with +3.7% sales growth, indicating the top tier is stable by rank despite mixed momentum. This pattern—incremental rank gain of 2 positions year over year but no movement over the last 3 months—implies Mr. Moxey's is consolidating a mid-table position rather than breaking back toward its August 2025 peak, and near-term rank shifts will likely hinge on whether leaders’ negative growth translates into share reallocation rather than automatic upward mobility.

Notable Products
CBC/THC 1:1 Energize Peppermint Mints 20-Pack (100mg CBC, 100mg THC) posted the steepest decline at -35.7% month over month while holding rank 5, and CBD/THC 40:1 Zen Peppermint Mints 20-Pack (800mg CBD, 20mg THC) fell -39.6% at rank 10. In contrast, Energizing Peppermint Mints 20-Pack (100mg) rose +22.6% to rank 1 and the CBG/CBD/THC 1:1:1 Relief Lemon Ginger Mints 20-Pack (100mg CBG, 100mg CBD, 100mg THC) edged up +2.0% at rank 2. Eight of the top ten are Edible mints sharing Peppermint or functional blends, and combined leader sales reached $94,755, which suggests the portfolio is consolidating around a few flagship form factors while higher-ratio CBD skus retrench.
Top Selling Cannabis Brands
Data for this report comes from real-time sales reporting by participating cannabis retailers via their point-of-sale systems, which are linked up with Headset’s business intelligence software. Headset’s data is very reliable, as it comes digitally direct from our partner retailers. However, the potential does exist for misreporting in the instance of duplicates, incorrectly classified products, inaccurate entry of products into point-of-sale systems, or even simple human error at the point of purchase. Thus, there is a slight margin of error to consider. Brands listed on this page are ranked in the top twenty within the market and product category by total retail sales volume.

