Market Insights Snapshot
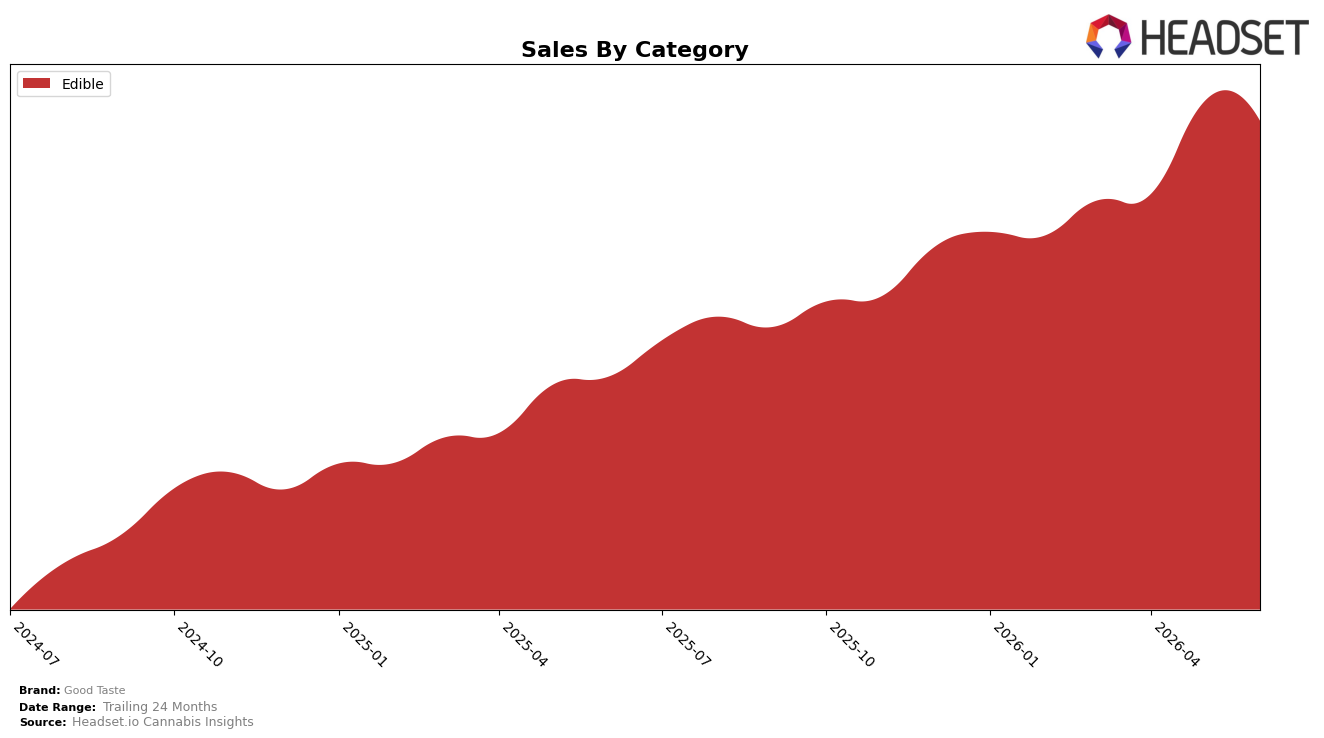
In June 2026, Good Taste remained a single-category brand with Edible at 100.0% mix, pairing 65.3% year-over-year sales growth with a 2.9% month-over-month dip, while average price rose 25.8% YoY alongside a 100.0% category share concentration. Within Edible, the brand’s rank in Missouri stood at 4, and the month-to-month softness contrasted with the year-over-year surge, implying that demand expanded faster than the broader Edible set over twelve months but cooled sequentially as price climbed. The pattern implies Good Taste is leaning into premium positioning inside Edible, trading short-term volume volatility for sustained share ownership of its sole category.
The shift toward higher average price at +25.8% YoY combined with a 65.3% YoY sales gain and a 2.9% MoM decline indicates elasticity is present but manageable, with ranking at 4 suggesting headroom to gain if pricing supports retention rather than churn. With 100.0% exposure to Edible and a 414.0% 24-month sales increase, the mix concentration magnifies both upside and downside, so sustaining June 2026 rank 4 in Missouri likely depends on stabilizing month-to-month swings while preserving elevated price points. The implication is that Good Taste’s positioning benefits from focused Edible leadership today, but risk-adjusted growth would improve by moderating price-led volatility or adding a secondary category to buffer sequential demand dips.
Competitive Landscape
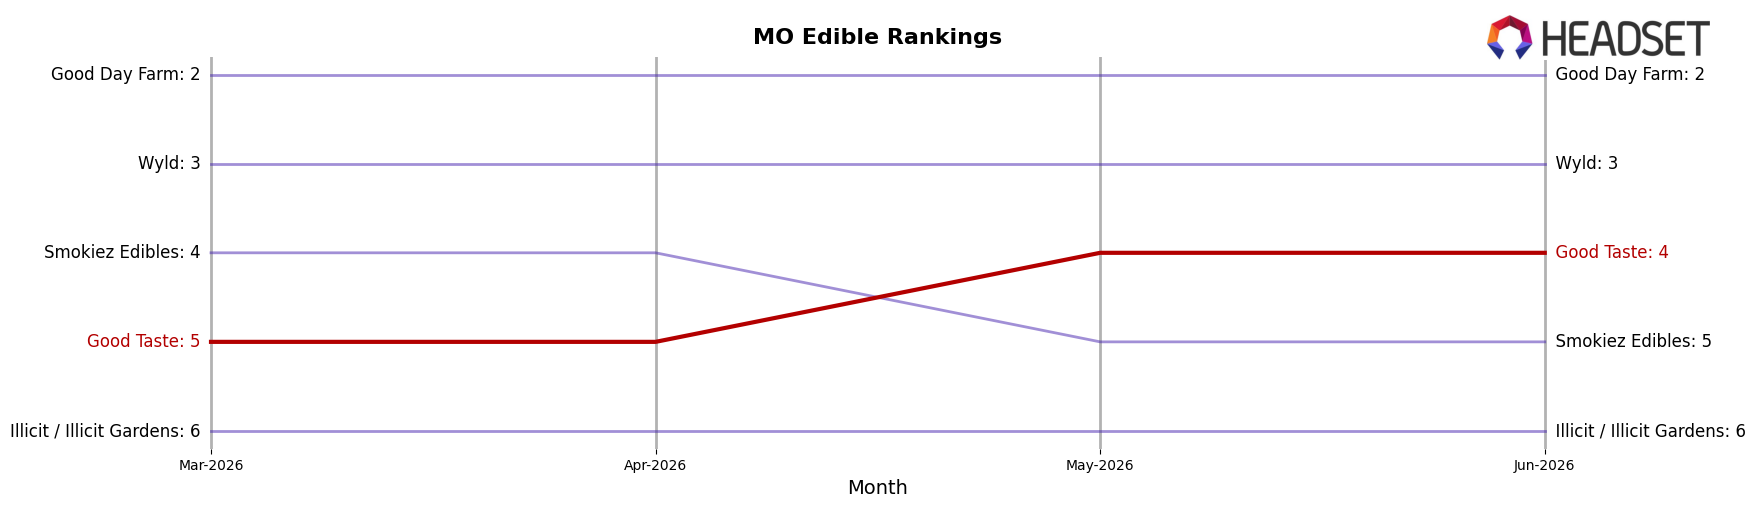
Good Taste is currently ranked #4 in MO Edible, improving 4 positions year over year from #8 and edging up 1 spot since March 2026 from #5, while hitting a peak rank of #4 in June 2026; in contrast, Good Day Farm advanced from #4 to #2 and grew sales by 19.4% YoY, and Smokiez Edibles slid from #2 to #5 with a 23.4% YoY sales decline. The top slot held by Gron / Grön is unchanged at #1 despite a 13.1% YoY sales drop, while Wyld held steady at #3 with a 2.2% YoY decline, indicating that Good Taste’s climb into the top four amid mixed competitor momentum points to share capture from declining incumbents rather than broad category expansion.
Notable Products
Fruitfetti Crispies 10-Pack (1000mg) posted the steepest decline in June 2026 at -10.5% while holding rank 7, and Patriot Pop Gummy (100mg) fell -15.8% at rank 8, indicating higher volatility at the lower end of the top 10. In contrast, Pink Lemonade High Dose Gummies 10-Pack (300mg) rose +10.0% to maintain rank 1 with $102,867, as Blackberry Yuzu Gummies 20-Pack (1000mg) slipped -3.6% at rank 3. With all ten products in Edible and multiple 1000mg SKUs sitting in ranks 3, 5, and 7, the mix points to dose-led concentration where high-milligram formats rely on fewer, larger baskets while mid-milligram leaders provide steadier throughput.
Top Selling Cannabis Brands
Data for this report comes from real-time sales reporting by participating cannabis retailers via their point-of-sale systems, which are linked up with Headset’s business intelligence software. Headset’s data is very reliable, as it comes digitally direct from our partner retailers. However, the potential does exist for misreporting in the instance of duplicates, incorrectly classified products, inaccurate entry of products into point-of-sale systems, or even simple human error at the point of purchase. Thus, there is a slight margin of error to consider. Brands listed on this page are ranked in the top twenty within the market and product category by total retail sales volume.

