.svg)

Sep-2026
Sales
Trend
6-Month
Product Count
SKUs
Avg Price
YoY Sales Change
YoY Price Change


Where to Buy
Greenlight is stocked at 119 licensed dispensaries across Missouri, Oregon, and 4 other states, 75 of them in Missouri, with the deepest coverage in Kansas City, St. Louis, Springfield, Cape Girardeau, and Joplin. Search by ZIP code or city below to find the closest one, or filter by product type if you are after a specific format.
Market Insights Snapshot
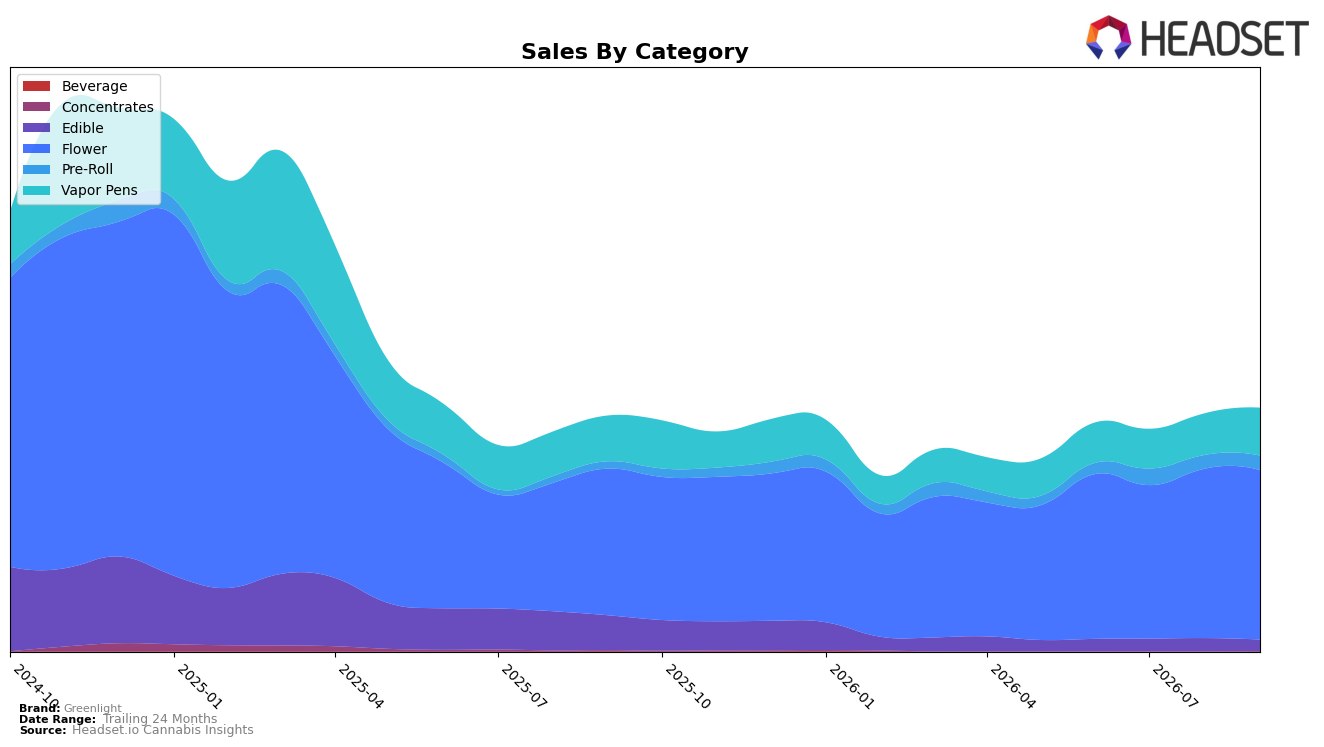
In September 2026, Greenlight concentrated 69.80% of sales in Flower, where year-over-year growth hit 15.60% and month-over-month edged up 0.08%, while Vapor Pens held 19.63% share with 4.50% YoY and 15.08% MoM growth. Pre-Roll expanded to 5.83% share on 102.75% YoY and 5.25% MoM increases, contrasted by Edible at 4.59% share with a -67.72% YoY and -13.46% MoM decline; Concentrates remained at 0.14% share despite a -72.14% YoY contraction and a 396.85% MoM rebound. With Greenlight ranked 18 in Flower in Missouri and the brand-wide YoY sales up 3.32% alongside a 4.14% YoY average price lift to $35.72, the mix implies reliance on Flower momentum to offset Edible and Concentrates drag.
The mix shift pushes Greenlight toward combustion-led positioning: Flower’s 69.80% share paired with a rank of 18 in Missouri Flower suggests depth over breadth, while Pre-Roll’s 102.75% YoY surge and Vapor Pens’ 15.08% MoM lift indicate consumers trading into inhalables rather than Edibles’ -67.72% YoY contraction. Given average Flower pricing at $44.59 versus Vapor Pens at $29.70 and Pre-Roll at $16.50, share gains in lower-priced inhalables can boost unit velocity even as category price mix pressures margin; the implication is to lean into Flower and Pre-Roll for traffic while using Vapor Pens’ double-digit MoM to stabilize monthly volatility.
Competitive Landscape
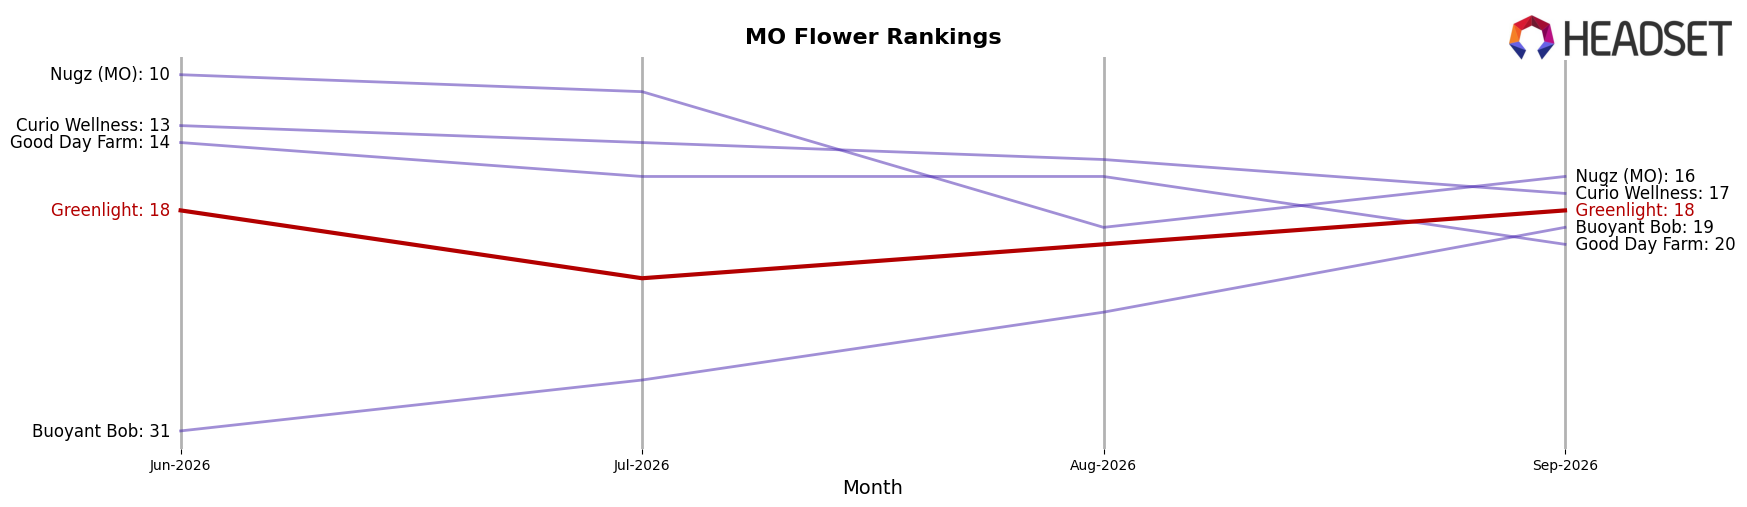
In September 2026, Greenlight ranks #18 in MO Flower, improving 2 positions from #20 year over year, while holding flat versus June 2026 at #18; this stability contrasts with Amaze Cannabis climbing from #6 to #2 and Sinse Cannabis holding at #3 despite an 11.1% year-over-year sales decline. Greenlight’s current #18 sits well below its peak #8 reached in January 2025, whereas Flora Farms maintained #1 with approximately 33.4% year-over-year sales growth and Vibe Cannabis (MO) moved up from #7 to #5 on 16.4% year-over-year growth; the mix of modest rank recovery and a two-quarter plateau implies Greenlight’s trajectory is stabilizing rather than accelerating, signaling a need to convert consistency into upward share gains.
Notable Products
Girl Scout Cookie Distillate Cartridge (1g) posted the largest jump with a 73.3% month-over-month gain to rank 4, while category leader Gold - Rainbow Snowman (3.5g) slipped 6.6% yet held rank 1. Honey Bunz (3.5g) also declined 7.5% at rank 5, and Skywalker OG Distillate Cartridge (1g) fell 6.3% at rank 10, creating a mixed top-10 where Vapor Pens are ascending against softening Flower.
Three Vapor Pens occupy ranks 4, 6, 8, and 10, indicating four of the top ten are Vapor Pens, with Acapulco Gold Distillate Cartridge (1g) up 37.9% at rank 6 while Maui Wowie Distillate Cartridge (1g) held rank 8 on steady volume near $23,373. With Flower concentrated across five SKUs in the top ten but showing two declines of 6.6% and 7.5% versus one Vapor Pen decline of 6.3% alongside a 73.3% surge, the mix implies a pivot toward inhalable oil demand and a need to defend Flower leadership while allocating push behind fast-rising cartridges.
Top Selling Cannabis Brands






Data for this report comes from real-time sales reporting by participating cannabis retailers via their point-of-sale systems, which are linked up with Headset’s business intelligence software. Headset’s data is very reliable, as it comes digitally direct from our partner retailers. However, the potential does exist for misreporting in the instance of duplicates, incorrectly classified products, inaccurate entry of products into point-of-sale systems, or even simple human error at the point of purchase. Thus, there is a slight margin of error to consider. Brands listed on this page are ranked in the top twenty within the market and product category by total retail sales volume.

