.svg)

Sep-2026
Sales
Trend
6-Month
Product Count
SKUs
Avg Price
YoY Sales Change
YoY Price Change


Where to Buy
Smokey River Cannabis is stocked at 63 licensed dispensaries across Missouri and Mississippi, 56 of them in Missouri, with the deepest coverage in Columbia, St. Louis, Springfield, Cape Girardeau, and Jefferson City. Search by ZIP code or city below to find the closest one, or filter by product type if you are after a specific format.
Market Insights Snapshot
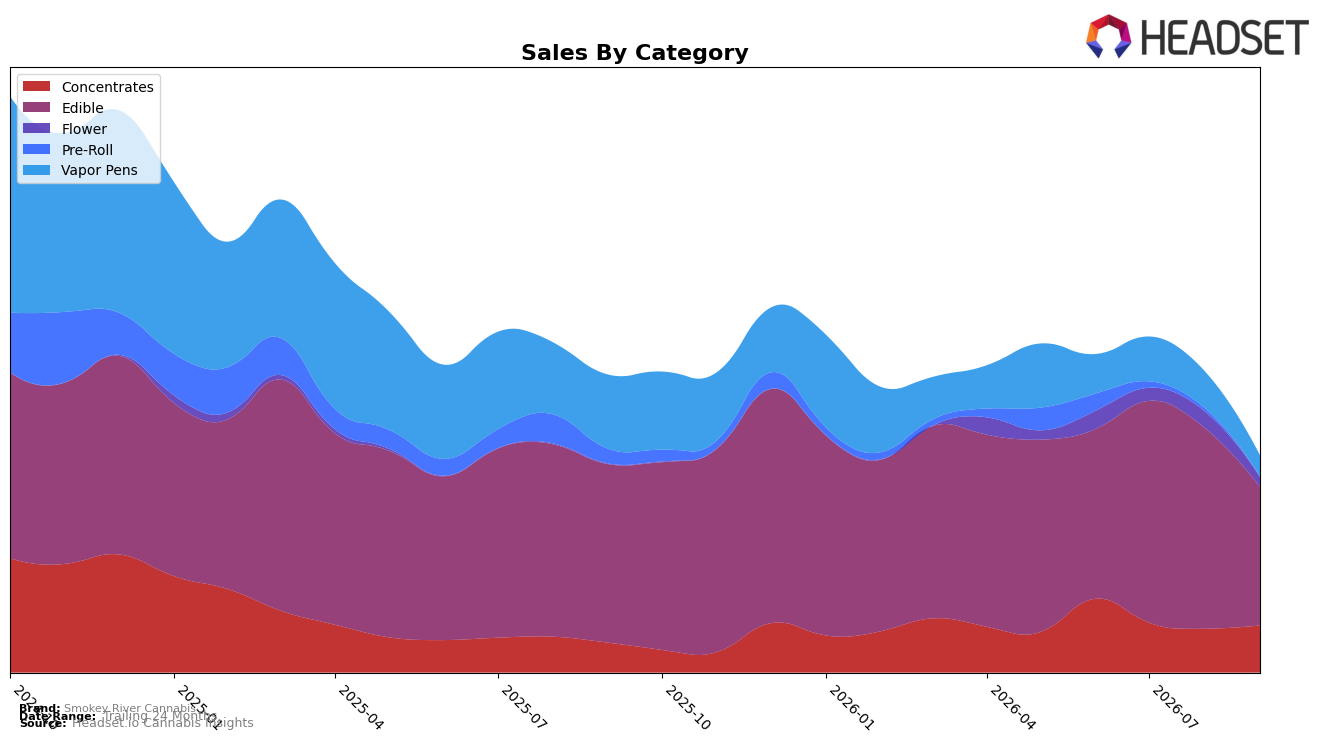
Smokey River Cannabis concentrated 63.95% of September 2026 sales in Edible, where year-over-year declined 22.46% and month-over-month fell 31.08%, while overall brand sales were down 27.18% YoY amid a 3.27% YoY increase in average price. Concentrates rose to 21.73% share with 58.13% YoY growth and a 7.65% MoM increase, whereas Vapor Pens dropped to 9.74% share with a 71.52% YoY decline and a 42.54% MoM slide; Flower expanded 2,096.94% YoY but contracted 40.75% MoM to 4.52% share. In Missouri Edible specifically, the brand sat at rank 18 while Pre-Roll collapsed 99.17% YoY and 96.05% MoM to 0.06% share, implying a consolidation around a shrinking Edible base with opportunistic momentum in Concentrates but ongoing retrenchment in inhalable formats.
The mix shift toward Concentrates (+58.13% YoY, +7.65% MoM) alongside severe contraction in Vapor Pens (-71.52% YoY, -42.54% MoM) suggests the brand is migrating inhalable demand toward higher-potency formats, which may support price resilience despite Edible contraction and a rank of 18 in Missouri Edible. The outsized YoY surge in Flower (+2,096.94%) coupled with a 40.75% MoM pullback indicates recent distribution or SKU introductions that spiked from a low base but are not yet stable, while Pre-Roll’s 99.17% YoY collapse signals deliberate de-prioritization rather than temporary volatility; together this pattern implies Smokey River Cannabis is narrowing focus to defend Edible while cultivating a secondary beachhead in Concentrates to offset category-specific softness.
Competitive Landscape
Smokey River Cannabis sits at rank 18 in MO Edible in September 2026, down 3 positions from rank 15 year over year, and 1 spot lower than June 2026 when it was rank 17; versus a prior peak of rank 14 in December 2025, the brand’s trajectory indicates slippage relative to faster movers. Competitively, Good Day Farm advanced from rank 2 to rank 1 while posting a 12.98% year-over-year sales increase, and Gron / Grön fell from rank 1 to rank 2 alongside a 19.82% sales decline, signaling a reshuffle at the top that Smokey River Cannabis has not capitalized on; meanwhile, Good Taste climbed from rank 5 to rank 3 with 44.64% growth, widening the gap to mid-pack players. With a 3-position YoY rank drop and no rebound from the 3-month rank of 17, the pattern implies Smokey River Cannabis is ceding rank share to ascendant competitors and must change velocity to avoid further mid-teens stagnation.

Notable Products
Watermelon High Dose Gummies 10-Pack (1000mg) posted the steepest decline at -48.5% MoM, sliding to rank 4 while Strawberry Lemonade High Dose Gummies 10-Pack (1000mg) fell -41.6% to rank 2, indicating a compression at the top where Dewberry Super High Dose Gummies 10-Pack (1000mg) held rank 1 despite a -5.7% dip. Four of the top five SKUs are 1000mg Edibles and at least six of the top ten are Edibles overall, pointing to a heavy concentration in high-dose formats even as Apple Pie High Dose Gummies 10-Pack (1000mg) dropped -16.5% at rank 3 and Green Apple Gummies 10-Pack (1000mg) declined -37.3% at rank 5.
Among 100mg formats, Green Apple Fruit Gummies 10-Pack (100mg) was the sole MoM gainer at +11.1% at rank 7 while Watermelon Gummies 10-Pack (100mg) contracted -37.8% at rank 8, and Strawberry Lemonade Gummies 10-Pack (100mg) slipped -48.9% at rank 5 with $6,831 in sales. The pattern implies a portfolio tilted toward high-dose Edibles that is sensitive to flavor-level volatility, with a small 100mg foothold showing selective traction rather than broad momentum.
Top Selling Cannabis Brands






Data for this report comes from real-time sales reporting by participating cannabis retailers via their point-of-sale systems, which are linked up with Headset’s business intelligence software. Headset’s data is very reliable, as it comes digitally direct from our partner retailers. However, the potential does exist for misreporting in the instance of duplicates, incorrectly classified products, inaccurate entry of products into point-of-sale systems, or even simple human error at the point of purchase. Thus, there is a slight margin of error to consider. Brands listed on this page are ranked in the top twenty within the market and product category by total retail sales volume.

