Market Insights Snapshot
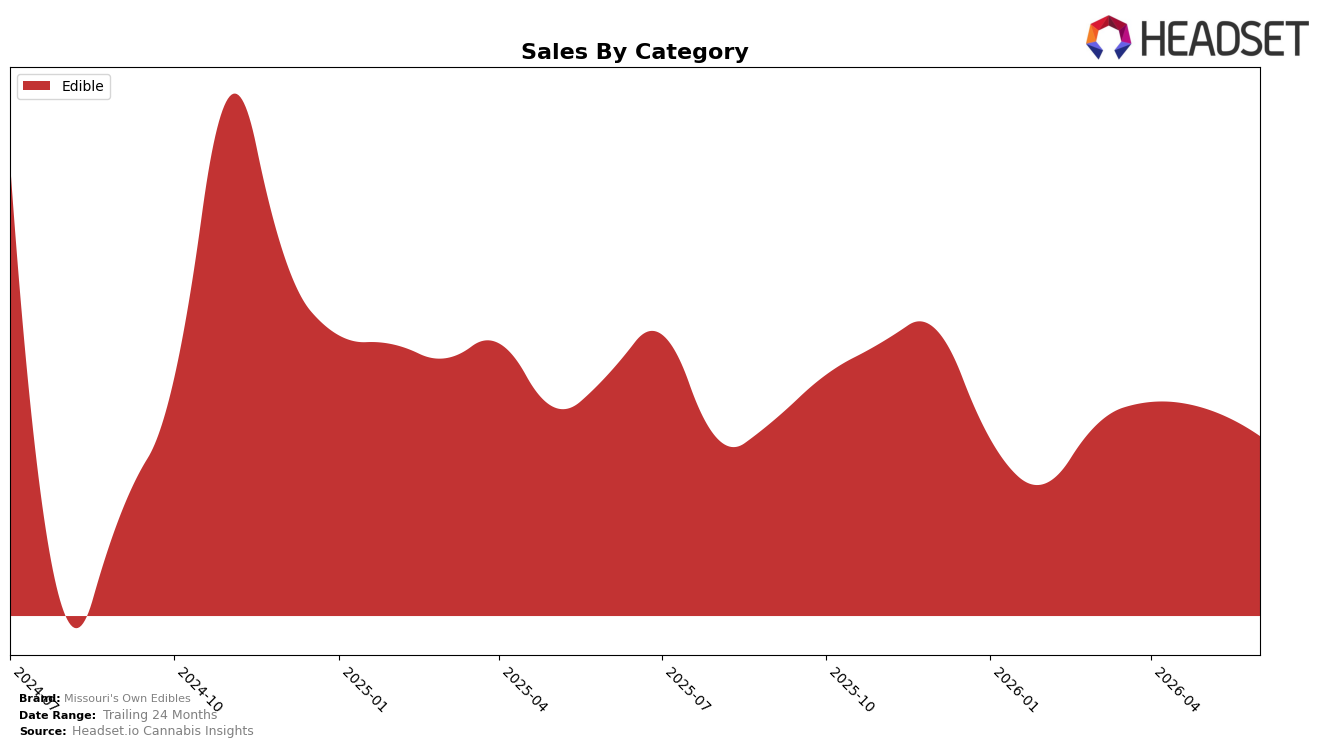
Missouri's Own Edibles operated as a single-category brand in June 2026, with Edible accounting for 100.0% of sales and holding rank 20 in Missouri Edibles. Within Edibles, sales declined 10.1% year over year and 4.8% month over month, while the average price slipped 1.2% year over year to $16.28. The combination of a 100.0% category concentration and a rank of 20 implies that share losses are entirely tied to Edible demand and pricing headwinds rather than mix dilution, pointing to a need to adjust assortment or pack-price architecture within the category.
The pattern suggests positioning pressure concentrated in the mid-tier of Missouri Edibles: a 1.2% price decline against a 10.1% sales drop indicates volume softness beyond pricing, and the additional 4.8% month-over-month dip alongside a fixed 100.0% mix implies limited buffer from cross-category offsets. With rank 20 anchoring the brand in the lower half of the leaderboard and all exposure in Edibles, the brand’s differentiation likely hinges on narrowing SKU focus toward faster-moving subtypes or sizes to regain velocity rather than seeking relief through further price compression.
Competitive Landscape
Missouri's Own Edibles sits at rank #20 in June 2026, down 2 positions from #18 year over year, while holding flat versus March 2026 at #20; by contrast, Good Day Farm advanced from #4 to #2 with a 19.4% YoY sales increase and Smokiez Edibles slipped from #2 to #5 alongside a 23.4% YoY sales decline, indicating that Missouri's Own Edibles is neither capturing the upward momentum of movers nor benefiting from competitor pullbacks. Compared with peak positioning at #15 in November 2024 and the current #20, the 5-rank slide alongside Gron / Grön holding #1 year over year with a 13.1% YoY sales contraction suggests Missouri's Own Edibles is ceding relative share despite softness at the very top; the trajectory implies a need to arrest gradual rank erosion as faster-rising peers consolidate spots above.

Notable Products
THC/CBG 1:2 Sativa Peach Gummies 10-Pack (50mg THC, 100mg CBG) posted the steepest decline at -39.8% and slid to rank 9, while CBN/THC 1:1 Indica Blackberry Gummies 10-Pack (100mg CBN, 100mg THC) fell -12.8% yet held rank 1. In contrast, CBG/THC 1:2 Sour Watermelon Gummies 10-Pack (50mg CBG, 100mg THC) surged +82.7% into rank 5 and CBG/THC 1:1 Sweet Green Apple Gummies 10-Pack (100mg CBG, 100mg THC) climbed +44.8% at rank 2. With all top-10 items in Edible and several CBG-forward SKUs moving up while two high-THC or mixed-ratio options dropped double digits, the pattern implies a shift toward balanced or CBG-led formulations as the brand’s demand anchor.
Top Selling Cannabis Brands
Data for this report comes from real-time sales reporting by participating cannabis retailers via their point-of-sale systems, which are linked up with Headset’s business intelligence software. Headset’s data is very reliable, as it comes digitally direct from our partner retailers. However, the potential does exist for misreporting in the instance of duplicates, incorrectly classified products, inaccurate entry of products into point-of-sale systems, or even simple human error at the point of purchase. Thus, there is a slight margin of error to consider. Brands listed on this page are ranked in the top twenty within the market and product category by total retail sales volume.

