.svg)
Aug-2026
Sales
Trend
6-Month
Product Count
SKUs
Avg Price
YoY Sales Change
YoY Price Change


Market Insights Snapshot
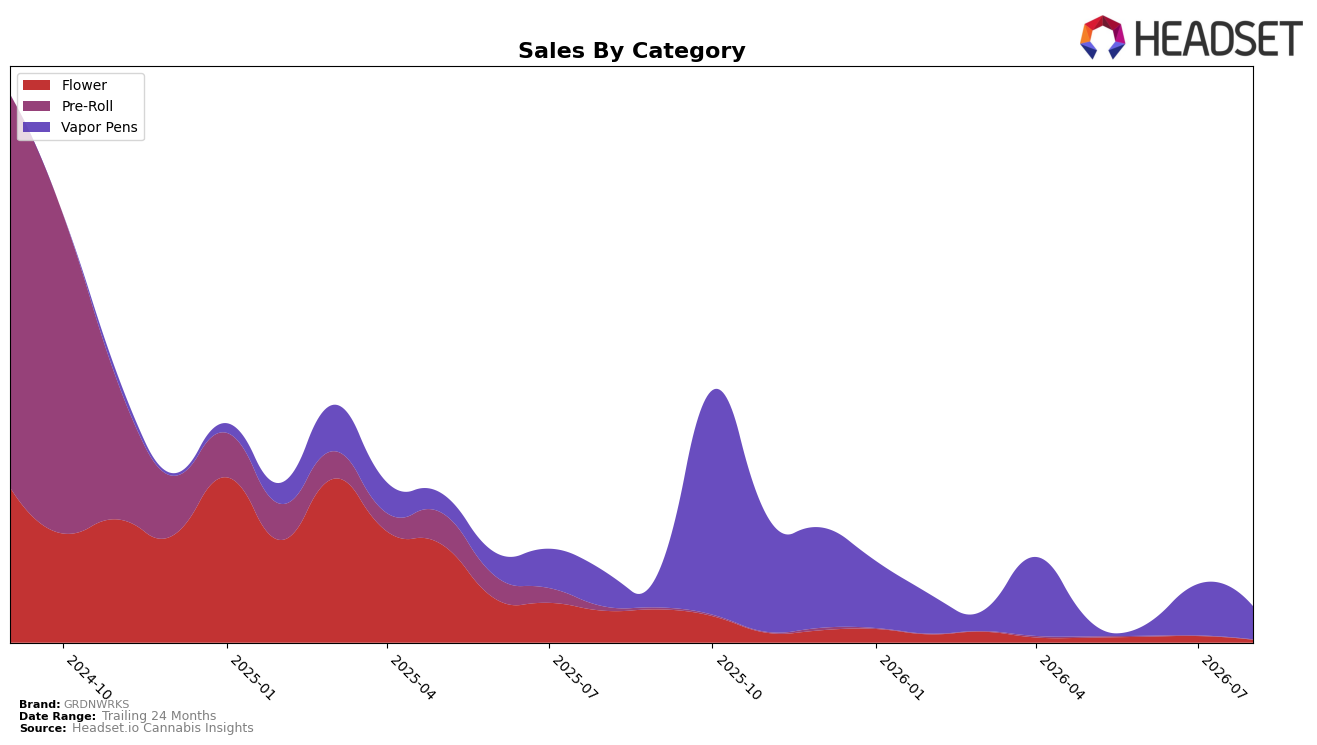
In August 2026, Vapor Pens accounted for 92.64% share while Flower held 7.36%, but both categories contracted: Vapor Pens fell 6.20% year over year and 35.80% month over month, and Flower declined 91.76% year over year and 58.70% month over month. Average price lifted 7.87% year over year to $29.85, with Vapor Pens averaging $30.78 versus Flower at $21.68, yet the category mix still tilted further toward Vapor Pens as Flower’s sharper month-over-month drop outpaced the 35.80% decline in Vapor Pens. The pattern implies the brand is consolidating around a single category leader while overall demand compression is magnified by a rapid pullback in Flower.
With Vapor Pens at 92.64% share and a category rank of 38 in Saskatchewan, GRDNWRKS is positioned as a niche, lower-tier participant whose volume is vulnerable to month-over-month volatility like the 35.80% contraction, especially when the secondary category posts a 58.70% decline. The 7.87% increase in average price alongside a 49.78% brand sales year-over-year decline indicates elasticity pressure rather than mix-upgrade benefit, while the 24-month sales decline of 91.09% underscores that reliance on Vapor Pens has not offset structural share loss. The implication is that defending rank will require either reactivating Flower above its 7.36% share or diversifying into adjacent formats to reduce sensitivity to Vapor Pen swings and stabilize monthly performance.
Competitive Landscape
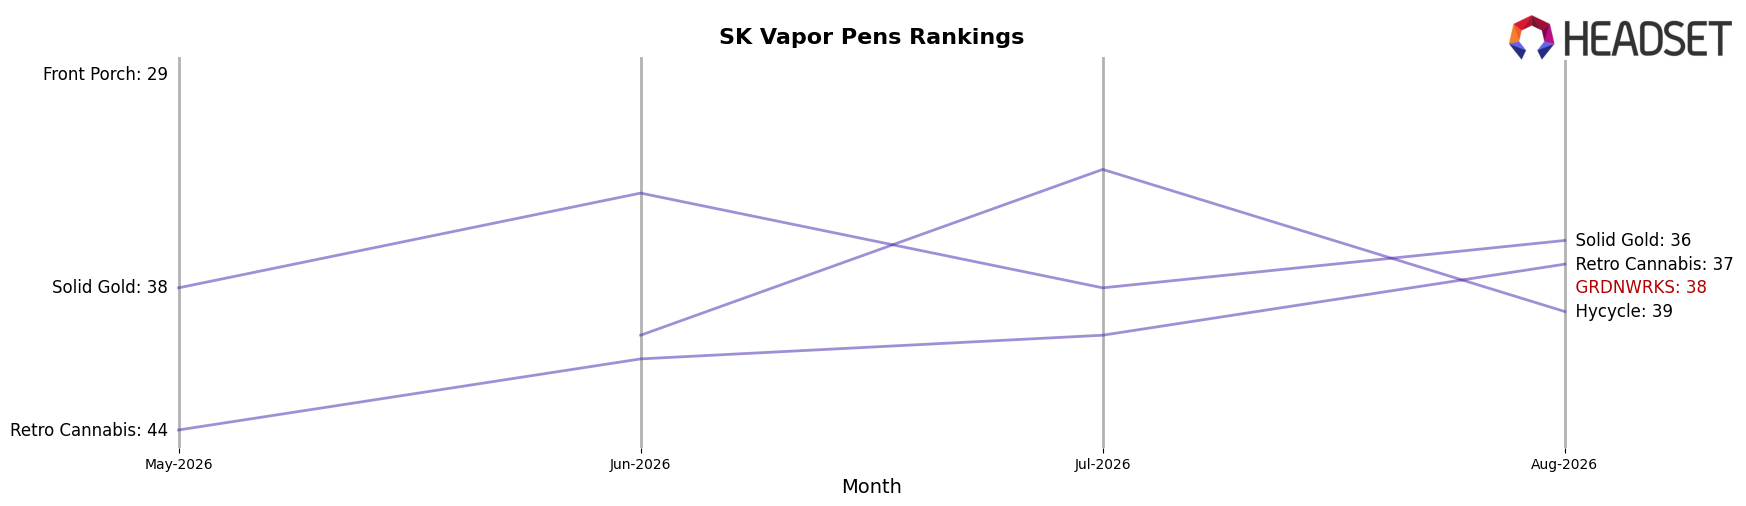
GRDNWRKS is currently ranked #38 in SK Vapor Pens, improving 20 positions from #58 in May 2026 to #38 in August 2026 while sitting 4 spots below its April 2026 peak at #34; in contrast, Spinach holds #1 with a 29.8% YoY sales increase and BoxHot sits at #4 despite a 4.2% YoY sales decline. The brand’s rise from #58 to #38 over three months and gap from #34 to #38 indicate momentum from a mid-tier recovery but also signal headroom remains before reclaiming peak positioning.
Notable Products
Slurp Cloud Distillate Disposable (1g) posted the largest move with a 3,959.5% month-over-month surge to $10,636 and jumped to rank 1, while Maliboo Breeze Distillate Disposable (1g) fell 82.2% and slid to rank 2. Sunrise Rush Milled (7g) dropped 57.7% at rank 3 and Sunrise Citrus Slurry Milled (7g) declined 62.8% at rank 4, concentrating two of the top four in Flower despite both contracting sharply. With Vapor Pens occupying ranks 1 and 2 alongside double-digit contractions in Flower, the mix implies GRDNWRKS is pivoting toward disposable Vapor Pens as the near-term volume anchor and away from milled Flower.
Top Selling Cannabis Brands






Data for this report comes from real-time sales reporting by participating cannabis retailers via their point-of-sale systems, which are linked up with Headset’s business intelligence software. Headset’s data is very reliable, as it comes digitally direct from our partner retailers. However, the potential does exist for misreporting in the instance of duplicates, incorrectly classified products, inaccurate entry of products into point-of-sale systems, or even simple human error at the point of purchase. Thus, there is a slight margin of error to consider. Brands listed on this page are ranked in the top twenty within the market and product category by total retail sales volume.

