.svg)

Sep-2026
Sales
Trend
6-Month
Product Count
SKUs
Avg Price
YoY Sales Change
YoY Price Change


Market Insights Snapshot
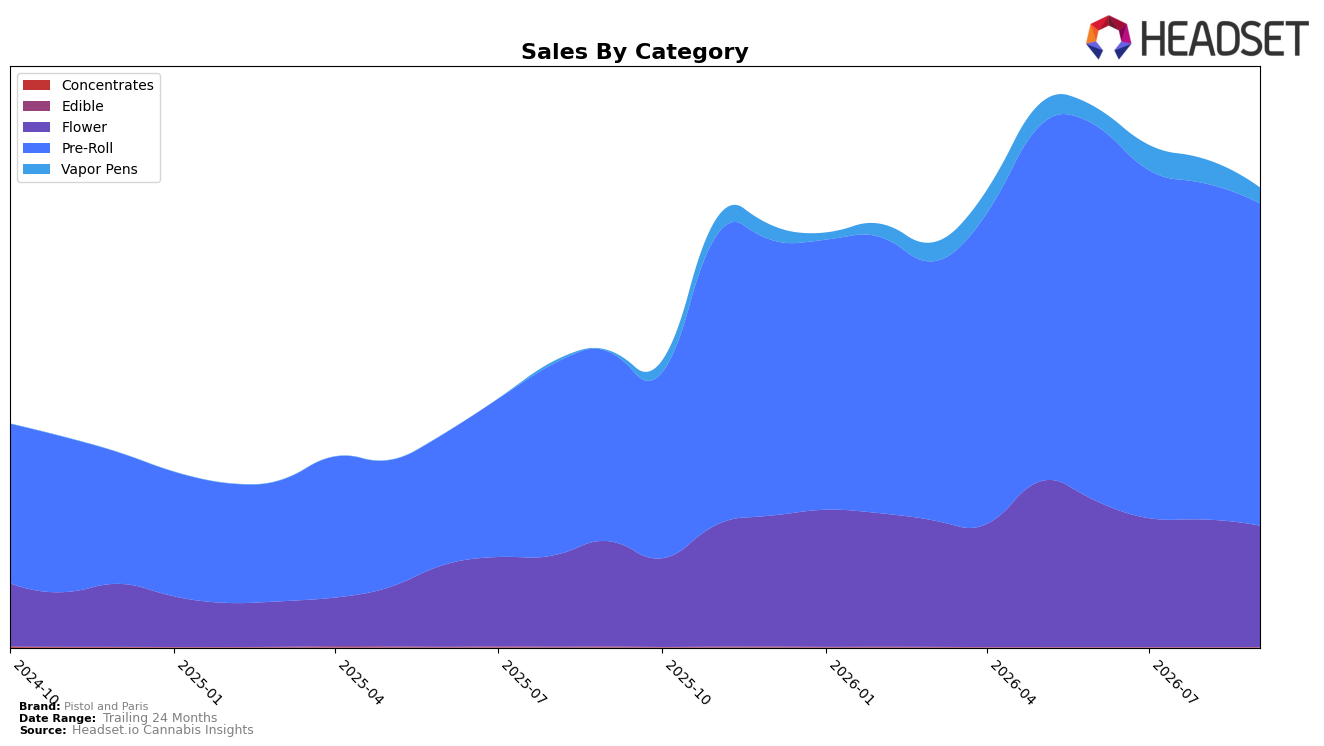
Pistol and Paris concentrated 70.19% of September 2026 sales in Pre-Roll, up 70.05% year over year but down 4.15% month over month, while Flower held 26.40% share with a 15.37% year-over-year increase and a 4.80% month-over-month decline. Vapor Pens remained a small 3.40% share despite a 1,483.24% year-over-year surge, pulled back by a 35.10% month-over-month drop, and average price across the brand rose 8.49% year over year to $24.88. The mix implies a reliance on Pre-Roll scale to carry growth in British Columbia even as shorter-term softness hits all three categories, indicating that September 2026 momentum came primarily from prior-year comp expansion rather than current-month velocity.
With Pre-Roll at rank 6 in British Columbia and accounting for 70.19% of sales, the brand’s positioning hinges on defending a top-10 Pre-Roll spot while managing a 4.15% month-over-month dip and leveraging a 70.05% year-over-year gain. Flower’s 26.40% share coupled with a 4.80% month-over-month decline and Vapor Pens’ 3.40% share alongside a 35.10% month-over-month contraction indicate limited buffer outside Pre-Roll, so the strategic implication is to tighten price-pack architecture around Pre-Roll’s $21.67 average to sustain rank 6 traction while using selective Vapor Pens activation to convert the 1,483.24% year-over-year lift into steadier month-over-month retention.
Competitive Landscape
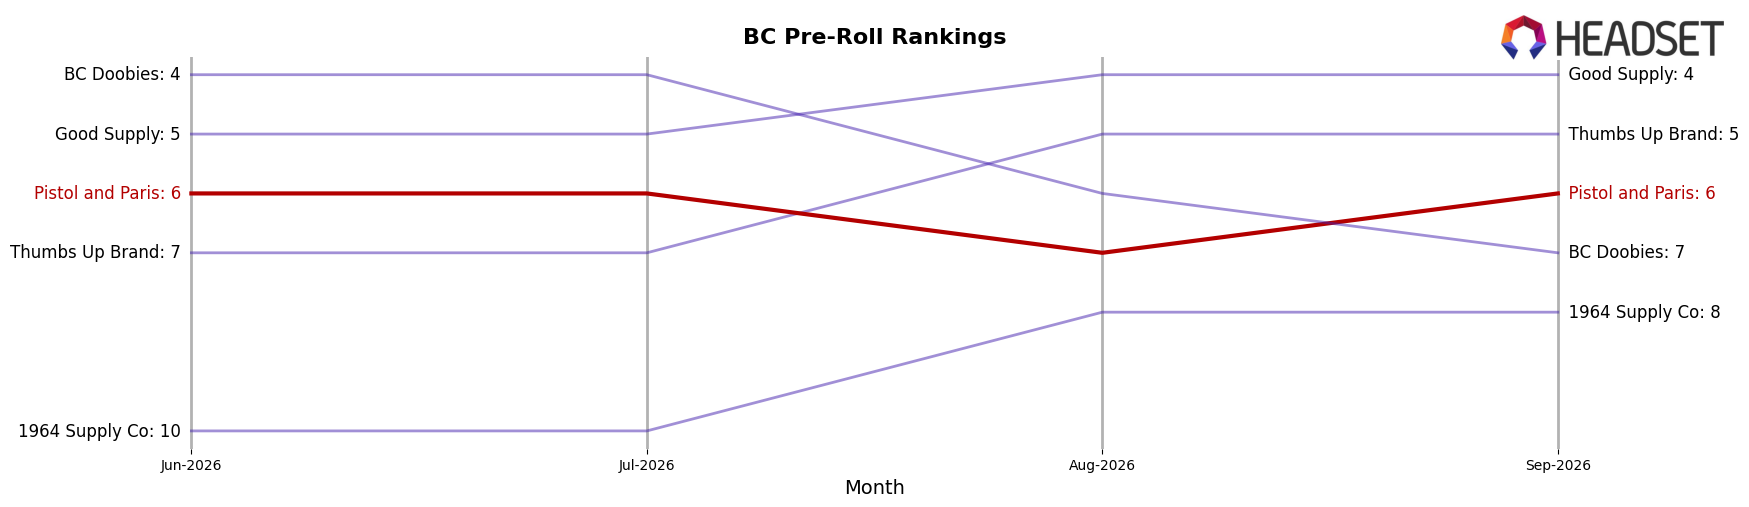
Pistol and Paris ranks #6 in BC Pre-Roll in September 2026, improving 2 positions YoY from #8 and holding flat versus June 2026 at #6; the brand’s prior peak was #2 in November 2025, indicating a 4-position slide from that high-water mark. Competitive movement shows Weed Me edging up from #2 to #1 while growing sales 28.6%, and Back Forty / Back 40 Cannabis jumping from #13 to #2 with 197.3% YoY sales growth, whereas General Admission dipped from #1 to #3 with an 8.5% sales decline; this pattern places Pistol and Paris in a mid-pack hold as faster risers compress headroom above, implying the brand must convert stability into share gains to avoid being boxed out of the top 5.
Notable Products
Pink Goo (3.5g) posted the steepest decline at -29.4% and slid to rank 8, while Hawaiian Fanta Pre-Roll 3-Pack (1.5g) fell -14.1% yet held rank 1. Against this, Pink Goo Pre-Roll (1g) inched up +2.0% at rank 4 and Hawaiian Fanta Pre-Roll 10-Pack (5g) gained +2.1% at rank 7. With nine of the top ten in Pre-Roll and only two Flower SKUs in the mix, the portfolio is concentrating around multi-pack Pre-Rolls at the expense of eighth-ranked Flower, implying resource allocation is tilting toward value-oriented, repeatable formats.
Top Selling Cannabis Brands






Data for this report comes from real-time sales reporting by participating cannabis retailers via their point-of-sale systems, which are linked up with Headset’s business intelligence software. Headset’s data is very reliable, as it comes digitally direct from our partner retailers. However, the potential does exist for misreporting in the instance of duplicates, incorrectly classified products, inaccurate entry of products into point-of-sale systems, or even simple human error at the point of purchase. Thus, there is a slight margin of error to consider. Brands listed on this page are ranked in the top twenty within the market and product category by total retail sales volume.

