Jun-2026
Sales
Trend
6-Month
Product Count
SKUs
Avg Price
YoY Sales Change
YoY Price Change
Market Insights Snapshot
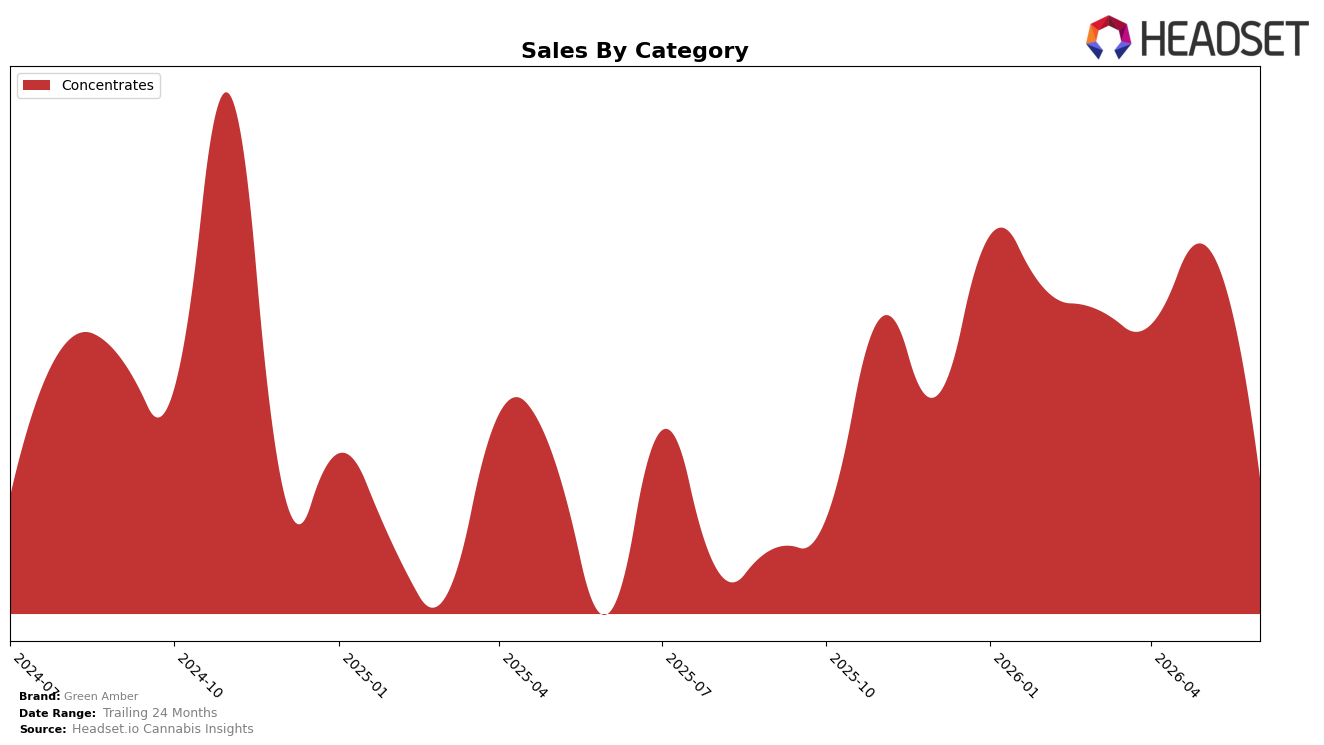
In June 2026, Green Amber’s sales were concentrated 100.0% in Concentrates, with year-over-year sales up 143.1% while month-over-month declined 50.2%; the brand held rank 28 in Concentrates in British Columbia, and average price fell 5.3% year-over-year to $51.54. The simultaneous triple signal — 100.0% category mix, a 143.1% annual lift, and a rank of 28 — implies a narrow but scaling footprint that pulled demand forward earlier in the year, leaving June’s 50.2% month-over-month contraction as a normalization rather than a category exit.
The shift to a single-category strategy at 100.0% share, combined with a 5.3% price decrease and a rank position of 28 in British Columbia, indicates a price-to-velocity trade that lifted annual throughput but exposed monthly volatility. This pattern suggests Green Amber is competing on accessible Concentrates price tiers to build penetration, which can upgrade rank from 28 if sustained, but the 50.2% month-over-month drop signals inventory and promotional timing need smoothing to convert the 143.1% year-over-year surge into steadier baseline volume.
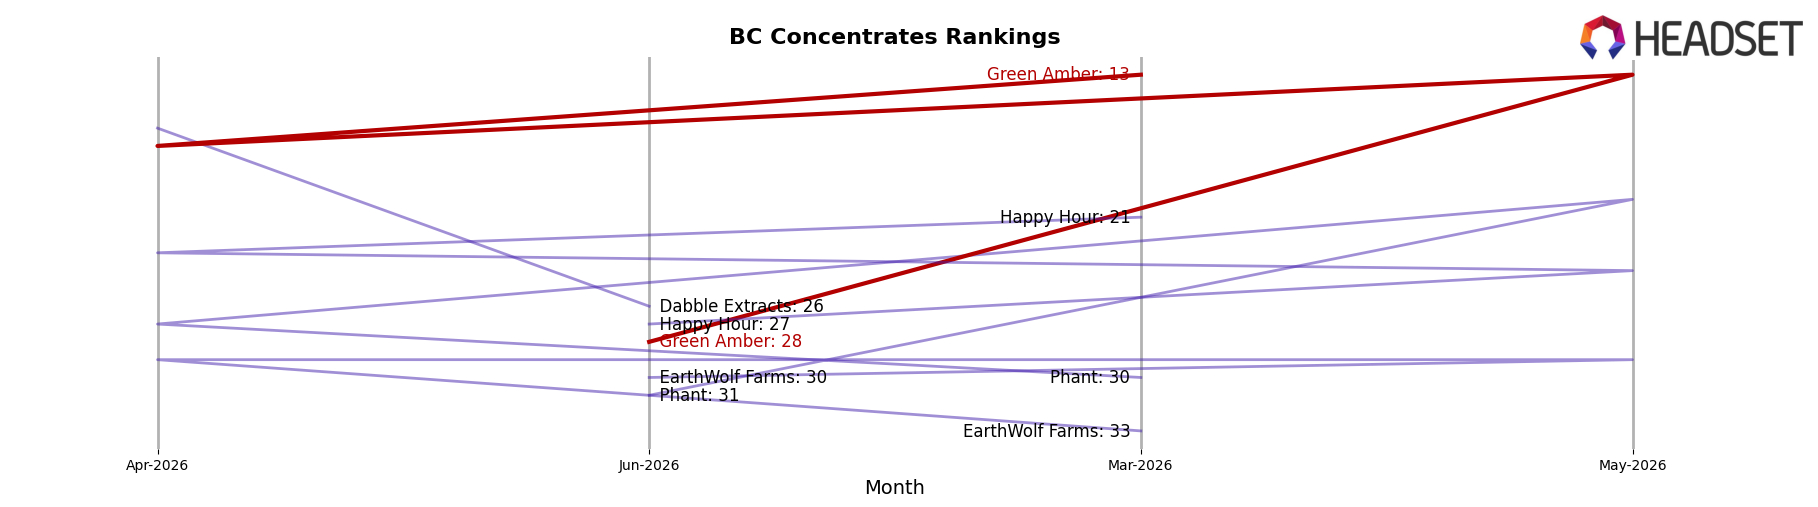
Competitive Landscape
Green Amber sits at rank #28 in BC Concentrates in June 2026, improving 11 spots from #39 year over year, but sliding 15 places from #13 three months prior, indicating volatility rather than linear progress; meanwhile, BoxHot climbed from #10 to #3 alongside 109.6% YoY sales growth while Vortex Cannabis Inc. held #2 despite a 38.2% YoY sales decline, and market leader Endgame maintained #1 with 13.8% YoY growth, which collectively implies Green Amber’s rank gains against last year are offset by recent share pressure and that sustaining position near its prior #12 peak from November 2024 will require reversing the quarter-on-quarter slide.
Notable Products
Garlic Guava Live Rosin (4g) posted the steepest decline at -84.98% MoM while still sharing rank 7, whereas Hybrid Solventless Live Rosin (1g) climbed 56.61% MoM to rank 2. Dosidos Live Rosin (1g) fell -60.17% MoM yet held rank 1, and Full Spectrum Solventless Live Rosin (1g) nearly doubled at +99.10% MoM to rank 6 with about $1.1k in sales. All top-10 entries are Concentrates, indicating a concentrated lineup where volatility at the top coexists with late-table gains, implying Green Amber is shifting mix toward solventless variants even as flagship SKUs retrench.
Top Selling Cannabis Brands
Data for this report comes from real-time sales reporting by participating cannabis retailers via their point-of-sale systems, which are linked up with Headset’s business intelligence software. Headset’s data is very reliable, as it comes digitally direct from our partner retailers. However, the potential does exist for misreporting in the instance of duplicates, incorrectly classified products, inaccurate entry of products into point-of-sale systems, or even simple human error at the point of purchase. Thus, there is a slight margin of error to consider. Brands listed on this page are ranked in the top twenty within the market and product category by total retail sales volume.

