.svg)

Sep-2026
Sales
Trend
6-Month
Product Count
SKUs
Avg Price
YoY Sales Change
YoY Price Change


Market Insights Snapshot
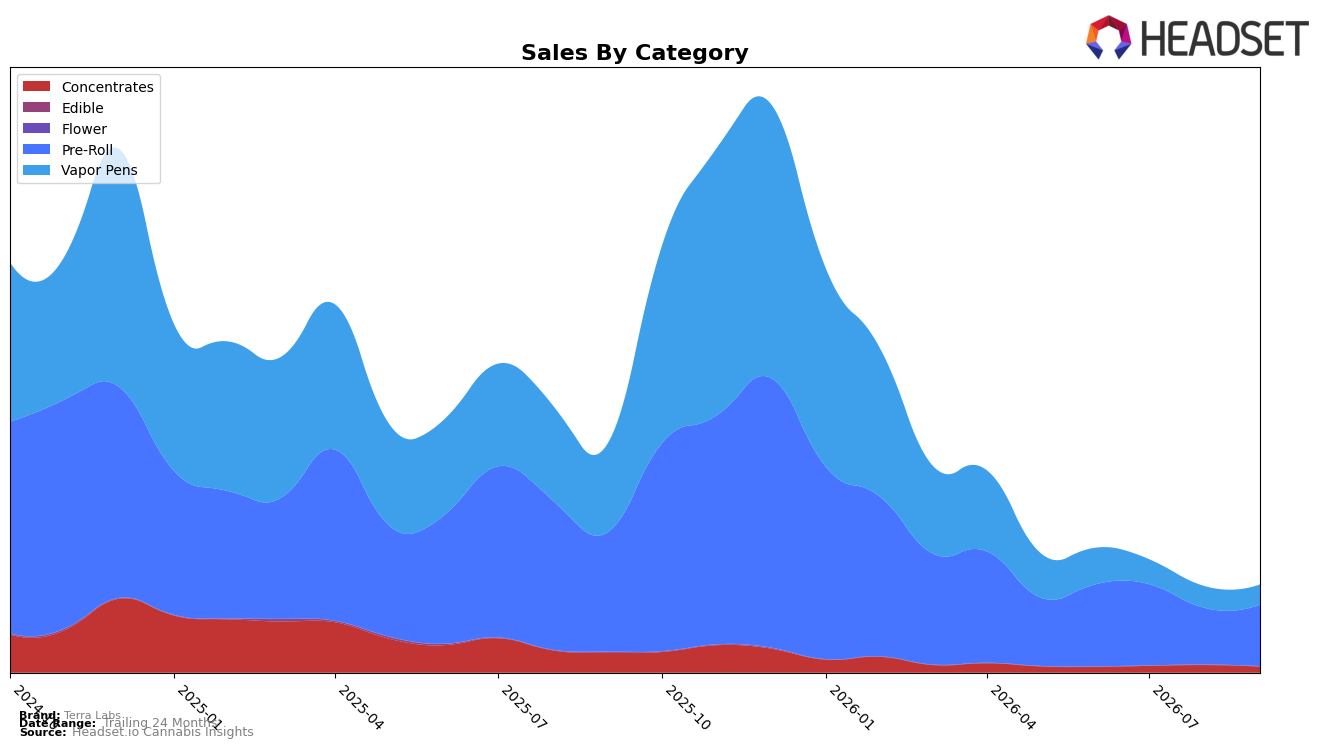
In September 2026, Terra Labs concentrated 70.40% of sales in Pre-Roll with month-over-month growth of 8.55% but a year-over-year decline of 48.78%, while Vapor Pens held 22.86% share with a 7.72% MoM drop and a 77.68% YoY contraction; Concentrates accounted for 6.75% share with a 21.09% MoM decline and a 70.21% YoY fall. Average price fell 9.36% YoY to $27.92, with category price points at $25.87 for Pre-Roll, $34.78 for Vapor Pens, and $33.16 for Concentrates, and Pre-Roll rank sat at 59 in British Columbia; the mix signals reliance on Pre-Roll momentum to offset deeper declines in Vapor Pens and Concentrates, implying the brand’s short-term volume stability depends on sustaining Pre-Roll’s MoM uplift despite broad YoY contraction.
The shift toward a 70%+ Pre-Roll mix alongside a 59th rank in British Columbia positions Terra Labs as a mid-pack Pre-Roll participant whose near-term gains are tied to improving execution in a single category, while category diversification is weakening as Vapor Pens and Concentrates shrink 7.72% and 21.09% MoM. With brand-level sales down 62.02% YoY alongside a 77.68% YoY decline in Vapor Pens, the portfolio tilts toward lower-priced Pre-Rolls at $25.87 versus higher-priced formats, implying Terra Labs is trading mix toward accessible Pre-Roll price points to defend share even as premium-oriented segments retract, and that future positioning hinges on either climbing ranks in Pre-Roll or rebuilding relevance in the two contracting categories.
Competitive Landscape
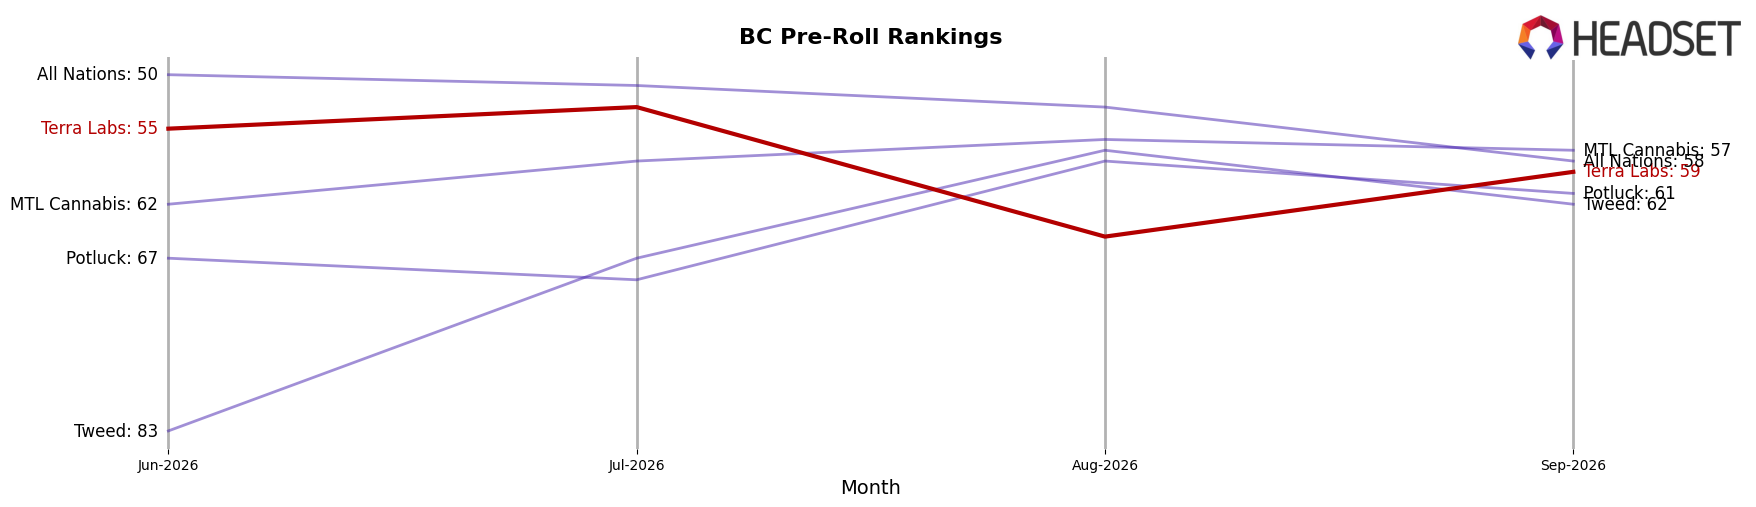
Terra Labs sits at rank #59 in September 2026, sliding 21 spots YoY from #38, and down 4 positions from June 2026’s #55, while remaining far below its peak of #6 in October 2025; meanwhile, Weed Me holds #1 after rising from #2 YoY with 28.6% sales growth, and Back Forty / Back 40 Cannabis advanced to #2 from #13 YoY on 197.3% growth, indicating Terra Labs’ relative share is being redistributed toward faster-ascending leaders. With General Admission easing from #1 to #3 on an 8.5% YoY sales decline while Good Supply improved from #6 to #4 on 43.0% growth, Terra Labs’ drop from #55 to #59 across the last three months and the 21-rank YoY decline imply a sustained erosion in competitive position that will continue unless mix, price, or distribution shifts counter the leaders’ momentum.
Notable Products
Raspberry Storm Infused Pre-Roll 3-Pack (1.5g) posted the most eye-catching swing in September 2026 with a +124.6% month-over-month jump to rank 2, while Formula 55 Kiwi Berry Infused Pre-Roll 3-Pack (1.5g) plunged -57.0% to rank 6, marking the steepest decline among the top ten. Strawberry Tsunami Diamond Infused Pre-Roll 5-Pack (2.5g) held rank 1 on +29.7% MoM, and Frosted Oranges Infused Pre-Roll (0.5g) climbed to rank 4 on +47.3% MoM, but Frosted Oranges Infused Pre-Roll (1g) simultaneously fell -41.6% to rank 8, indicating SKU-size cannibalization within a single flavor line. With eight of the top ten rooted in the Pre-Roll category and only one Vapor Pens SKU at rank 3 growing +42.4% MoM, the mix points to a Pre-Roll-led strategy that bets on multi-pack formats and flavor variants to drive velocity while ceding breadth to fewer non-Pre-Roll bets; the concentration implies Terra Labs is prioritizing repeatable, value-per-pack movement over category diversification.
Top Selling Cannabis Brands






Data for this report comes from real-time sales reporting by participating cannabis retailers via their point-of-sale systems, which are linked up with Headset’s business intelligence software. Headset’s data is very reliable, as it comes digitally direct from our partner retailers. However, the potential does exist for misreporting in the instance of duplicates, incorrectly classified products, inaccurate entry of products into point-of-sale systems, or even simple human error at the point of purchase. Thus, there is a slight margin of error to consider. Brands listed on this page are ranked in the top twenty within the market and product category by total retail sales volume.

