


Where to Buy
Green Ganja is stocked at 35 licensed dispensaries across Michigan and Washington, 34 of them in Michigan, with the deepest coverage in New Buffalo, Grand Rapids, Ironwood, Kalamazoo, and Menominee. Search by ZIP code or city below to find the closest one.
Market Insights Snapshot
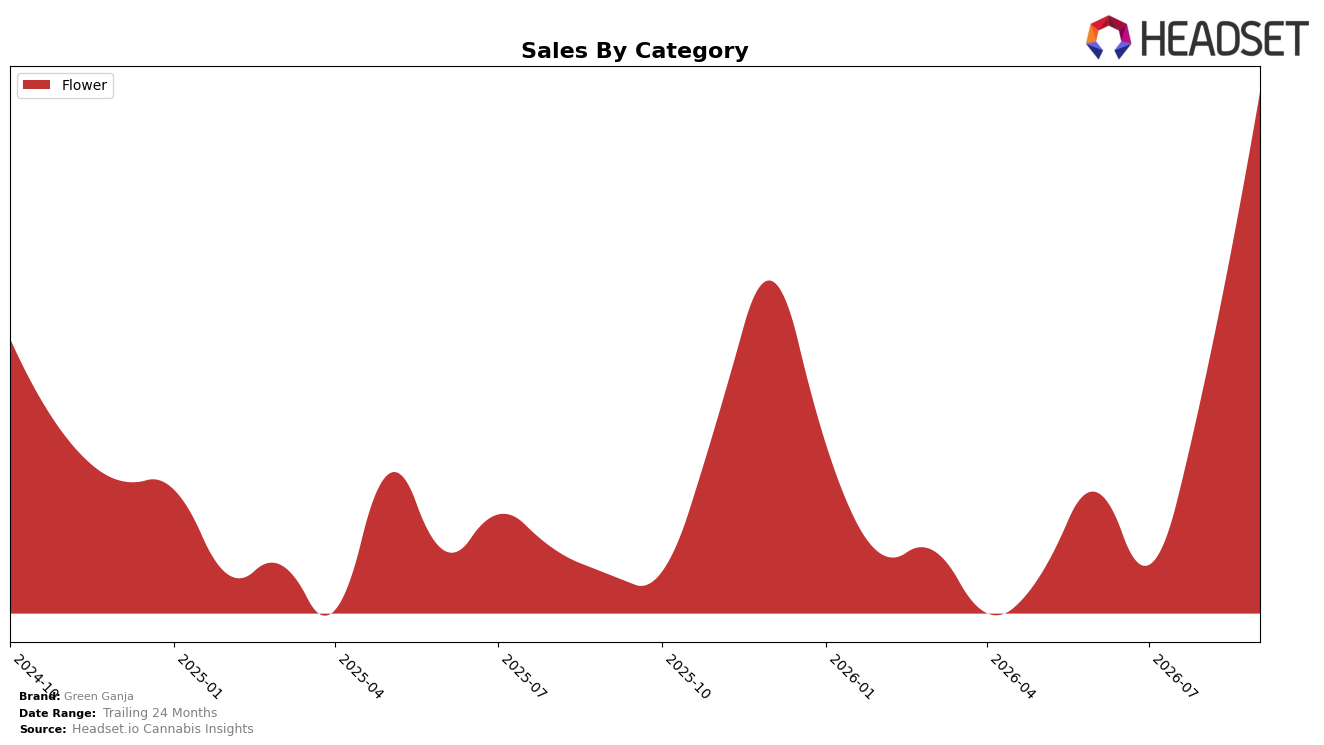
In September 2026, Green Ganja operated as a single-category brand with Flower accounting for 100.0% of sales, rising 227.5% year over year and 71.5% month over month. Average price in Flower increased 1.1% YoY to $47.63 while category share concentration at 100.0% indicates no diversification. With a rank of 15 in Flower within Michigan, the combination of a 227.5% YoY surge and a 71.5% MoM jump implies volume-led momentum in the core segment rather than breadth across categories.
The 100.0% reliance on Flower alongside a 15th place rank suggests headroom if Green Ganja converts recent 71.5% MoM growth into sustained share capture, but exposure risk if Flower pricing cools despite only a 1.1% YoY price lift. Concentration in a single category paired with 227.5% YoY brand sales growth implies a positioning anchored on scale within Flower in Michigan, where future gains likely require trading up the rank from 15 via mix upgrades or selective category expansion rather than further dependence on single-category volume spikes.
Competitive Landscape
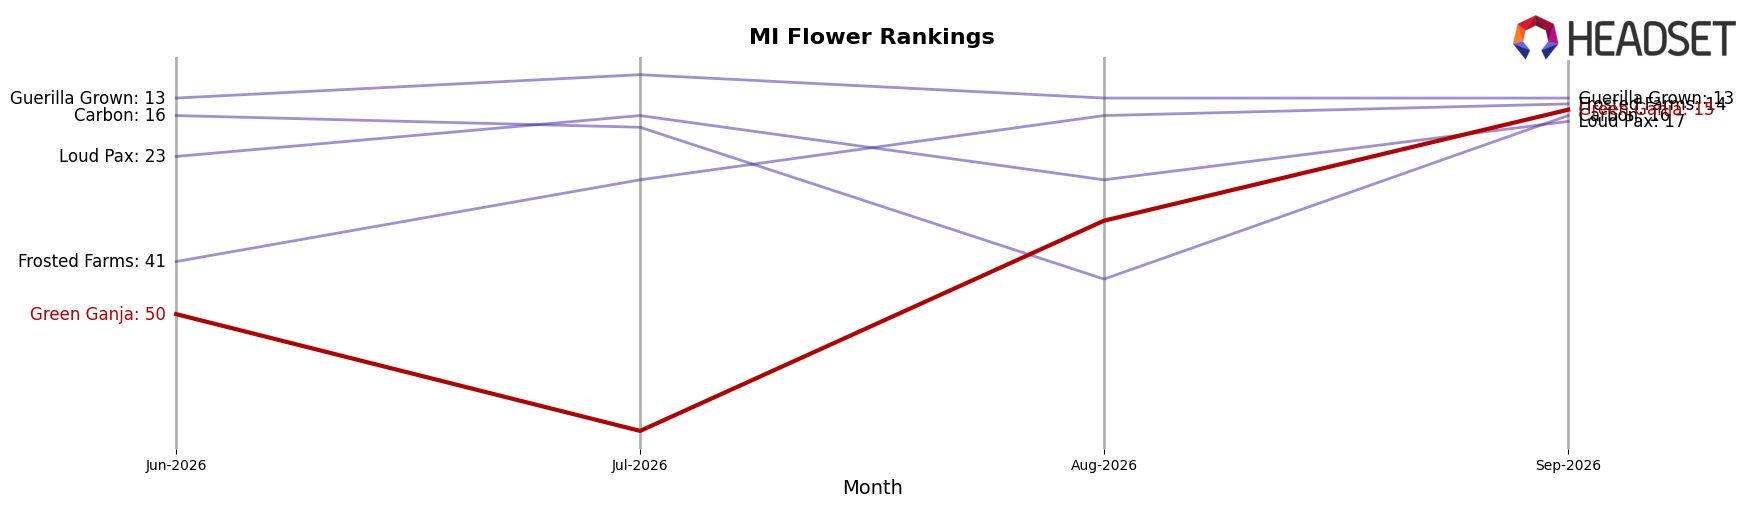
Green Ganja sits at rank #15 in MI Flower in September 2026, up 58 positions year over year from #73, and 35 spots higher than June 2026 when it was #50; this is also its peak to date at #15 in September 2026. Against the leaderboard, High Minded held #1 year over year and remains #1 despite a -3.3% sales change, while Play Cannabis moved from #7 to #2 with +33.3% sales, indicating Green Ganja’s late-surge rank delta outpaced top-tier incumbents’ stability and even faster-rising peers’ earlier momentum. The combination of a 58-place YoY climb and a 35-place improvement over three months implies Green Ganja is transitioning from fringe presence to established contender, with trajectory pointing toward sustained top-20 retention if momentum persists.
Notable Products
Superboof Smalls (Bulk) posted the standout move in September 2026 with a 154.2% month-over-month surge that helped concentrate Flower in the top ranks, while Superboof (Bulk) also advanced 67.5% to hold rank 1. In contrast, Orange Chem Cookies Smalls (Bulk) fell 22.9% and Tangie (Bulk) declined 13.9%, creating a bifurcation within Flower even as two Superboof variants pulled ahead. With nine of the top ten SKUs sitting in Flower and Superboof anchoring rank 1 and a second top-3 slot, the mix signals a shift toward scaling hero strains in bulk and smalls to drive velocity and margin focus.
Top Selling Cannabis Brands


Data for this report comes from real-time sales reporting by participating cannabis retailers via their point-of-sale systems, which are linked up with Headset’s business intelligence software. Headset’s data is very reliable, as it comes digitally direct from our partner retailers. However, the potential does exist for misreporting in the instance of duplicates, incorrectly classified products, inaccurate entry of products into point-of-sale systems, or even simple human error at the point of purchase. Thus, there is a slight margin of error to consider. Brands listed on this page are ranked in the top twenty within the market and product category by total retail sales volume.

