.svg)
Sep-2026
Sales
Trend
6-Month
Product Count
SKUs
Avg Price
YoY Sales Change
YoY Price Change


Where to Buy
Green Life Productions is stocked at 50 licensed dispensaries across Nevada, with the deepest coverage in Las Vegas, Henderson, Reno, North Las Vegas, and Carson City. Search by ZIP code or city below to find the closest one, or filter by product type if you are after a specific format.
Market Insights Snapshot
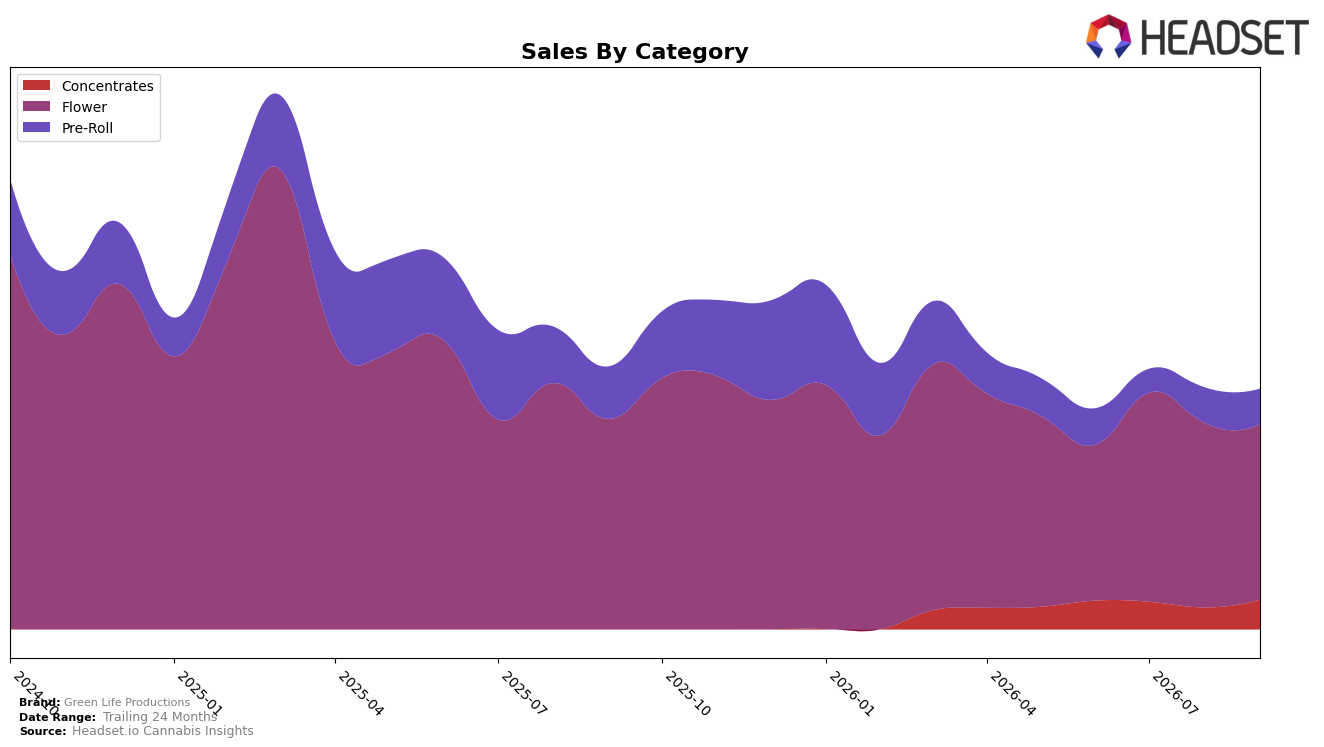
In September 2026, Flower held 73.03% share but fell 16.59% year over year and 4.92% month over month, while Pre-Roll at 14.69% share declined 32.33% YoY and was roughly flat MoM at -0.07%. Concentrates rose 35.60% MoM to 12.28% share despite no YoY baseline, and the brand’s average price dropped 5.36% YoY to $32.55 alongside an overall brand sales decline of 8.48% YoY. With Flower ranked 19th in Nevada, the pattern implies reliance on a contracting core category while a month-on-month shift toward Concentrates helps cushion, but not offset, aggregate pressure.
The moves suggest Green Life Productions is trading lower average price against a shrinking Flower mix and sharper Pre-Roll contraction, with a 31.59% 24-month sales decline indicating the strategy has not reversed share losses. Concentrates’ 35.60% MoM growth at a higher $47.69 average price versus Flower’s $31.35 and Pre-Roll’s $30.24 points to margin mix improvement, yet a 4.92% MoM slide in the 73.03% Flower base keeps the brand anchored near rank 19 in Nevada. The implication is that accelerating premium or terp-forward Concentrates while stabilizing Flower velocity is necessary to shift the portfolio toward categories with better price resilience and to lift rank out of the high-teens band.
Competitive Landscape
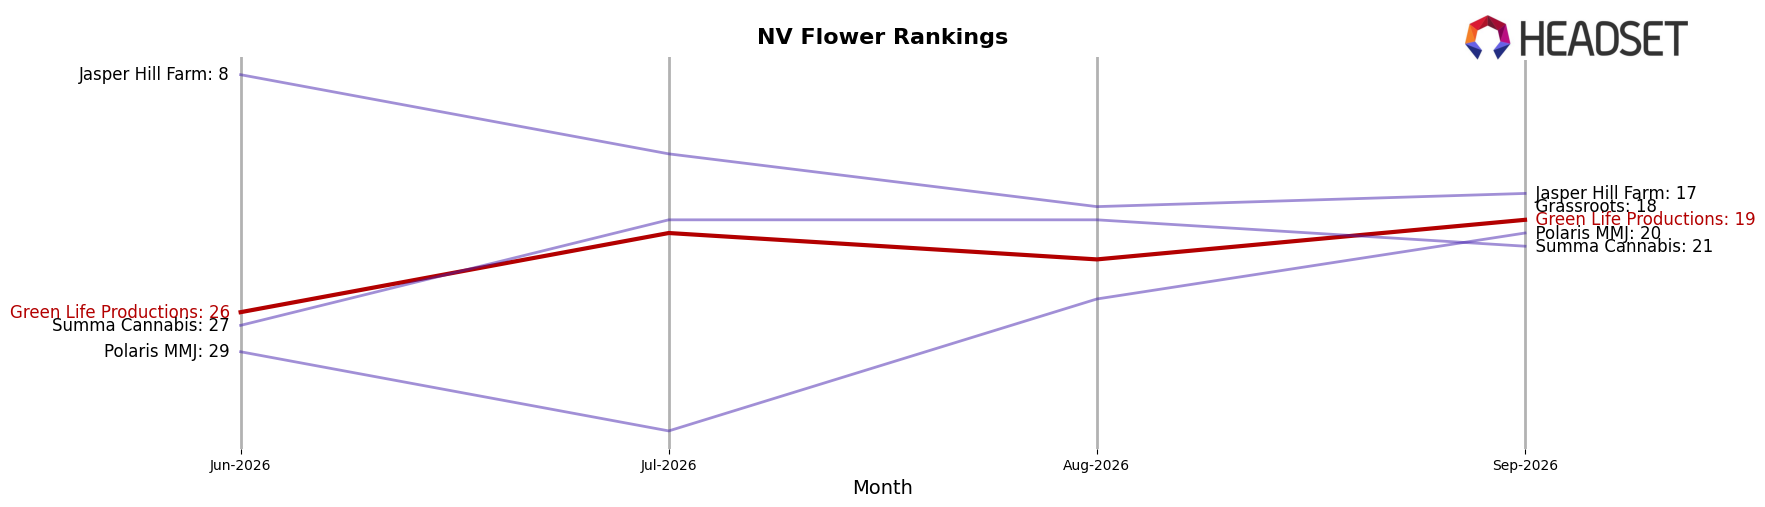
Green Life Productions sits at rank #19 in NV Flower for September 2026, a 3-position improvement from #22 year over year, and a 7-position climb from #26 in June 2026, while still trailing its peak of #9 in March 2025. Against the front-runners, RYTHM held #1 both year over year and in September 2026 with sales up 19.7% YoY, and STIIIZY stayed at #2 with 24.2% YoY growth, whereas Alternative Medicine Association / AMA climbed from #5 to #3 on 32.6% YoY growth; this context indicates Green Life Productions’ recent rank gains are recovery momentum rather than category leadership, implying a path of incremental share regain rather than immediate top-tier disruption.
Notable Products
Miss B (3.5g) delivered the standout move in September 2026 with a 184% month-over-month surge to the number 1 rank, while Blue Shocktartz (3.5g) slipped 13% yet held rank 2. Within Flower, MAC in the Day #4 (3.5g) advanced 45% to rank 5 as G7 (3.5g) fell 29% to rank 7, and Black Triangle (3.5g) dropped 47% to rank 9. With eight of the top ten SKUs concentrated in Flower and only one Pre-Roll entrant in the top ten, the mix points to a pivot toward high-velocity Flower strains over breadth across form factors.
Top Selling Cannabis Brands






Data for this report comes from real-time sales reporting by participating cannabis retailers via their point-of-sale systems, which are linked up with Headset’s business intelligence software. Headset’s data is very reliable, as it comes digitally direct from our partner retailers. However, the potential does exist for misreporting in the instance of duplicates, incorrectly classified products, inaccurate entry of products into point-of-sale systems, or even simple human error at the point of purchase. Thus, there is a slight margin of error to consider. Brands listed on this page are ranked in the top twenty within the market and product category by total retail sales volume.

