Market Insights Snapshot
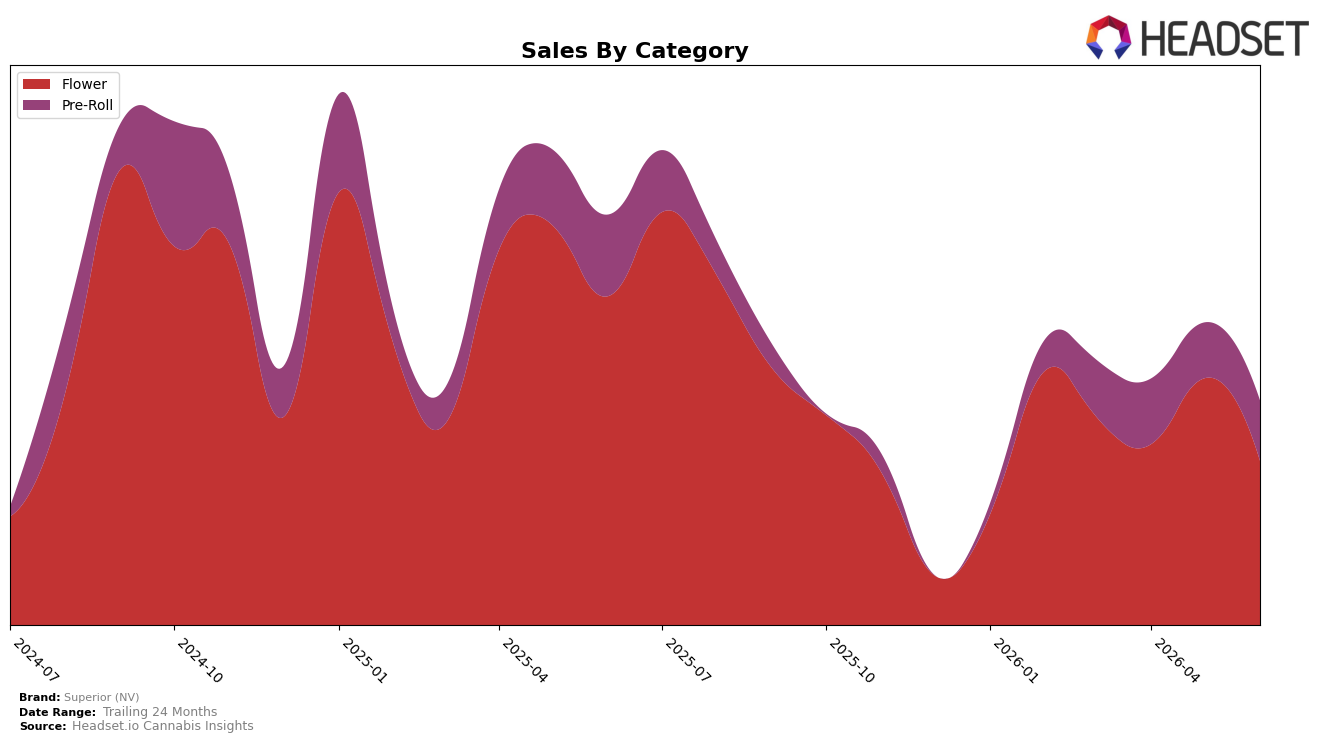
In June 2026, Superior (NV) concentrated 67.44% of sales in Flower and 32.56% in Pre-Roll, with Flower down 45.04% year over year and 29.14% month over month, while Pre-Roll declined 17.83% year over year but grew 5.09% month over month. Average price fell 30.54% year over year to $12.99, and Flower’s category rank in NV sat at 25, indicating a mid-pack position despite a 38.40% brand-level year-over-year sales decline. The pattern implies a deliberate pivot toward price-accessible formats and mix stabilization via Pre-Roll, as Flower volume and price compression weigh on the core.
With 24-month growth of 48.25% alongside a June 2026 year-over-year decline of 38.40%, the brand’s trajectory suggests earlier gains now being rebalanced as Flower loses share and momentum while Pre-Roll buffers with a 5.09% month-over-month lift. Holding rank 25 in Nevada Flower while Flower mix still represents 67.44% indicates concentration risk; the continuing 17.83% year-over-year Pre-Roll decline paired with month-over-month improvement points to a near-term shift toward lighter-weight, lower-price occasions rather than premium Flower recovery. The implication is that maintaining relevance will hinge on accelerating mix into Pre-Roll and improving price-pack architecture, using Flower as volume base rather than growth engine.
Competitive Landscape
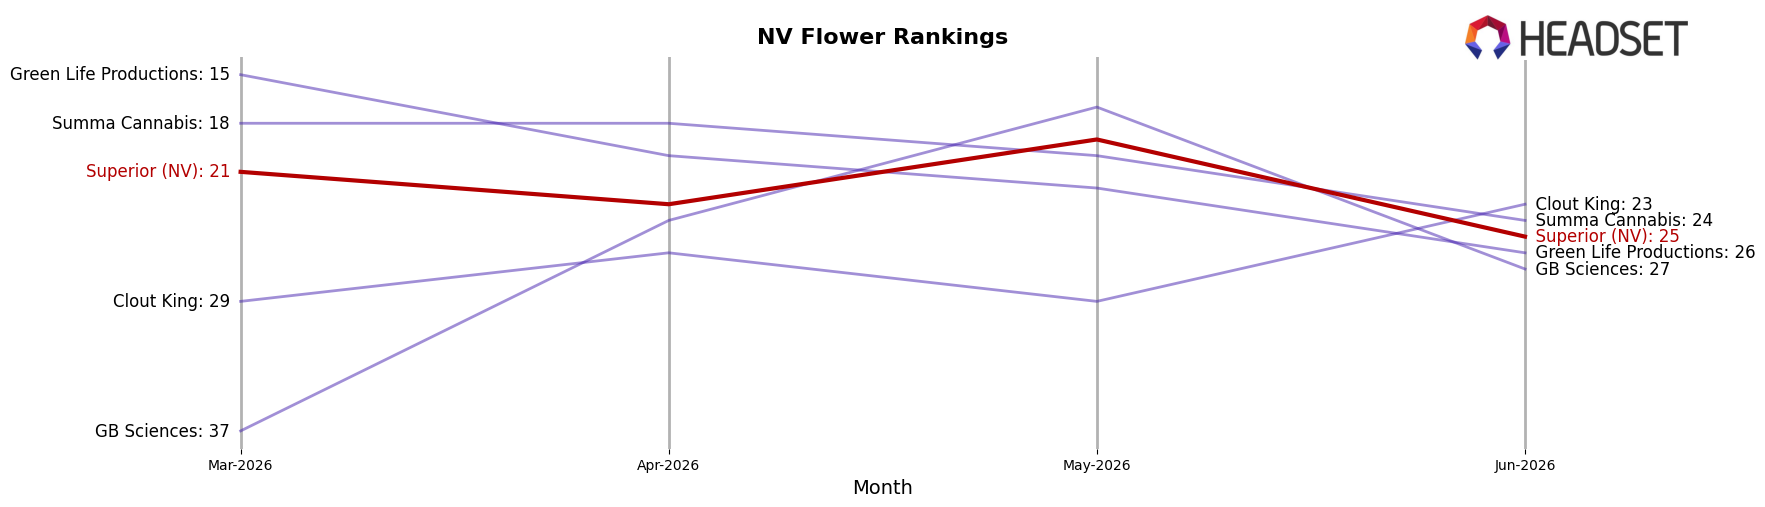
Superior (NV) sits at rank #25 in NV Flower in June 2026, sliding 10 positions year over year from #15 while also dropping 4 spots since March 2026 from #21, and this follows a retreat from its peak of #11 in September 2024. In the same window, STIIIZY held #1 with a 5.2% YoY sales increase while RYTHM advanced to #2 despite a -6.9% YoY sales rate, and FloraVega / Welleaf surged to #3 with a 22-rank YoY climb alongside 260.4% YoY sales growth; against that backdrop, Superior (NV)’s move from #21 to #25 quarter-on-quarter signals share is consolidating toward a few leaders, implying Superior (NV) must counter accelerating competitor gains rather than seasonal softness.
Notable Products
Super Lemon Haze Pre-Roll (1g) delivered the standout move in June 2026 with a +169.8% month-over-month jump to $15,855 and climbed into rank 2, while Hawaiian Punch Pre-Roll (1g) fell -18.3% yet held rank 1. Frankenstein Pre-Roll (1g) surged +123.4% to rank 4 as Alien Moon Pie Pre-Roll (1g) in rank 3 inched up only +2.1%, indicating momentum is consolidating in a few fast-rising pre-roll SKUs. The pattern implies Superior (NV) is pivoting toward pre-roll-led velocity where outsized gains in a couple of items outweigh softer leaders.
Flower undercut the mix with steep drops as Alien Moon Pie (3.5g) sank -43.6% at rank 7 and Hawaiian Punch (3.5g) declined -41.8% at rank 10, while two flower SKUs entered the top 10 with uncited month-over-month baselines at ranks 8 and 9. Six of the top ten are Pre-Roll SKUs, and two of the top three ranks are held by pre-rolls, signaling the category is concentrating share and displacing flower in the near term. This mix suggests Superior (NV) is leaning into quicker-turn pre-roll formats while de-emphasizing flower that carries sharper downside risk.
Top Selling Cannabis Brands
Data for this report comes from real-time sales reporting by participating cannabis retailers via their point-of-sale systems, which are linked up with Headset’s business intelligence software. Headset’s data is very reliable, as it comes digitally direct from our partner retailers. However, the potential does exist for misreporting in the instance of duplicates, incorrectly classified products, inaccurate entry of products into point-of-sale systems, or even simple human error at the point of purchase. Thus, there is a slight margin of error to consider. Brands listed on this page are ranked in the top twenty within the market and product category by total retail sales volume.

