Jun-2026
Sales
Trend
6-Month
Product Count
SKUs
Avg Price
YoY Sales Change
YoY Price Change
Market Insights Snapshot
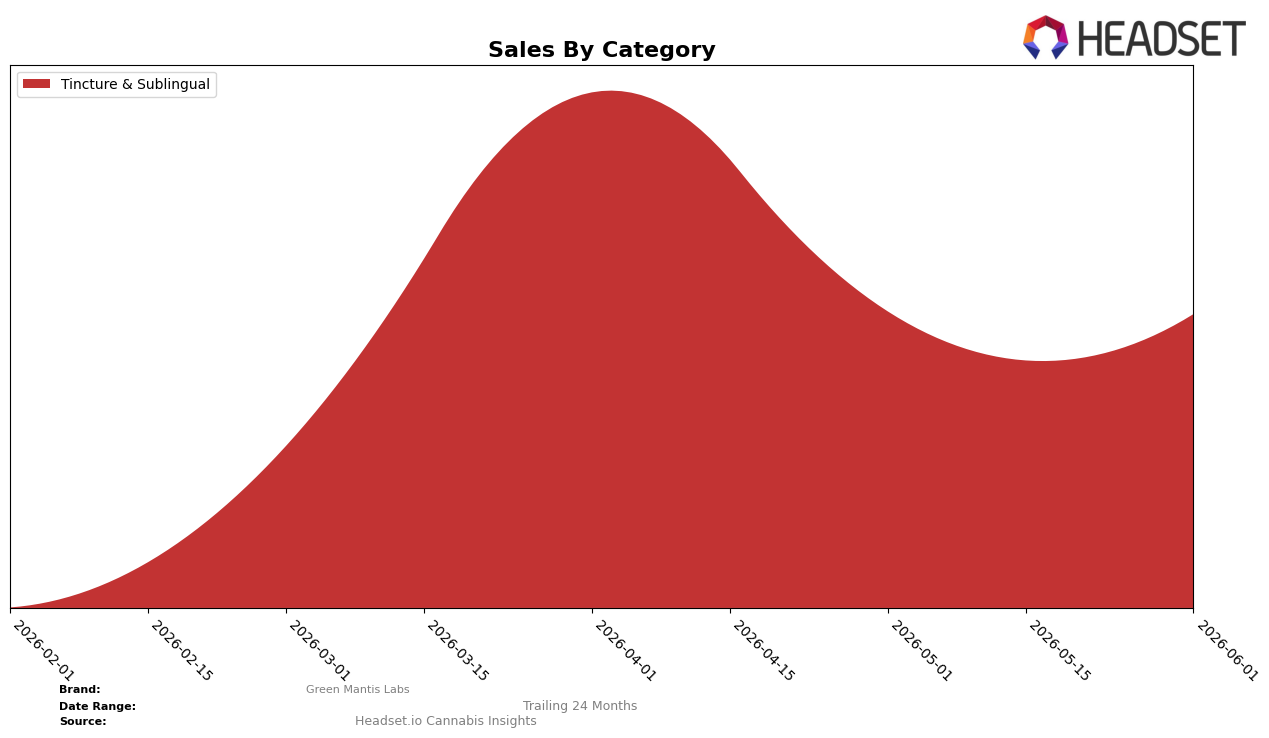
In June 2026, Green Mantis Labs concentrated entirely in Tincture & Sublingual with a 100.0% category share and a month-over-month change of -0.90% alongside a current rank of 11 in New York’s Tincture & Sublingual segment. While year-over-year movement is not reported for this category, the combination of a full category allocation at 100.0% and a rank position of 11 implies a narrow focus that trades breadth for depth in New York, setting the stage for either targeted share defense or a controlled push up the rankings.
The alignment of a 100.0% category share with a rank of 11 suggests the brand’s positioning depends on extraction of incremental gains within Tincture & Sublingual rather than cross-category offsets, and the -0.90% month-over-month movement indicates sensitivity to small shifts in pricing or velocity at an average price of $40.26. The practical implication is that Green Mantis Labs must convert marginal efficiency or distribution wins into rank improvements within a single lane, because a flat year-over-year read and an 11th-place anchor leave limited buffer against further share erosion or a stall in upward mobility.
Competitive Landscape
Green Mantis Labs sits at rank #11 in NY Tincture & Sublingual for June 2026, improving 3 positions from #14 in March 2026, while remaining 2 spots below its peak at #9 in April 2026; by contrast, Ayrloom holds #1 with a year-over-year sales change of +16.5% and Head & Heal is #2 with -16.3% YoY, indicating that Green Mantis Labs’ climb of 3 ranks quarter-over-quarter occurs amid mixed top-tier momentum and suggests a trajectory geared toward re-entering the top 10 if it sustains gains against leaders whose YoY trends are uneven.

Notable Products
CBD/THC 1:1 Citrus Tincture (1000mg CBD, 1000mg THC) delivered the standout move in June 2026 with a +55.6% month-over-month surge to rank 1, while CBN/THC 2:1 Sleep Blueberry Tincture (400mg CBN, 200mg THC) fell -56.5% to rank 5. Watermelon Tincture (1000mg THC, 60ml) dropped -51.3% into rank 2 and the CBN/THC 1:2 Sleep Blueberry Tincture (300mg CBN, 600mg THC) slipped -4.6% to rank 3, as four of the top five SKUs came from the Tincture & Sublingual category. The mix implies Green Mantis Labs is consolidating around high-potency 1:1 citrus formats while sleep-oriented CBN variants are cycling down, signaling a pivot toward balanced daytime use cases over sedative niches.
Top Selling Cannabis Brands
Data for this report comes from real-time sales reporting by participating cannabis retailers via their point-of-sale systems, which are linked up with Headset’s business intelligence software. Headset’s data is very reliable, as it comes digitally direct from our partner retailers. However, the potential does exist for misreporting in the instance of duplicates, incorrectly classified products, inaccurate entry of products into point-of-sale systems, or even simple human error at the point of purchase. Thus, there is a slight margin of error to consider. Brands listed on this page are ranked in the top twenty within the market and product category by total retail sales volume.

