.svg)


Where to Buy
Halo Infusions is stocked at 22 licensed dispensaries across Arizona, with the deepest coverage in Phoenix, Tucson, Apache Junction, El Mirage, and Florence. Search by ZIP code or city below to find the closest one, or filter by product type if you are after a specific format.
Market Insights Snapshot
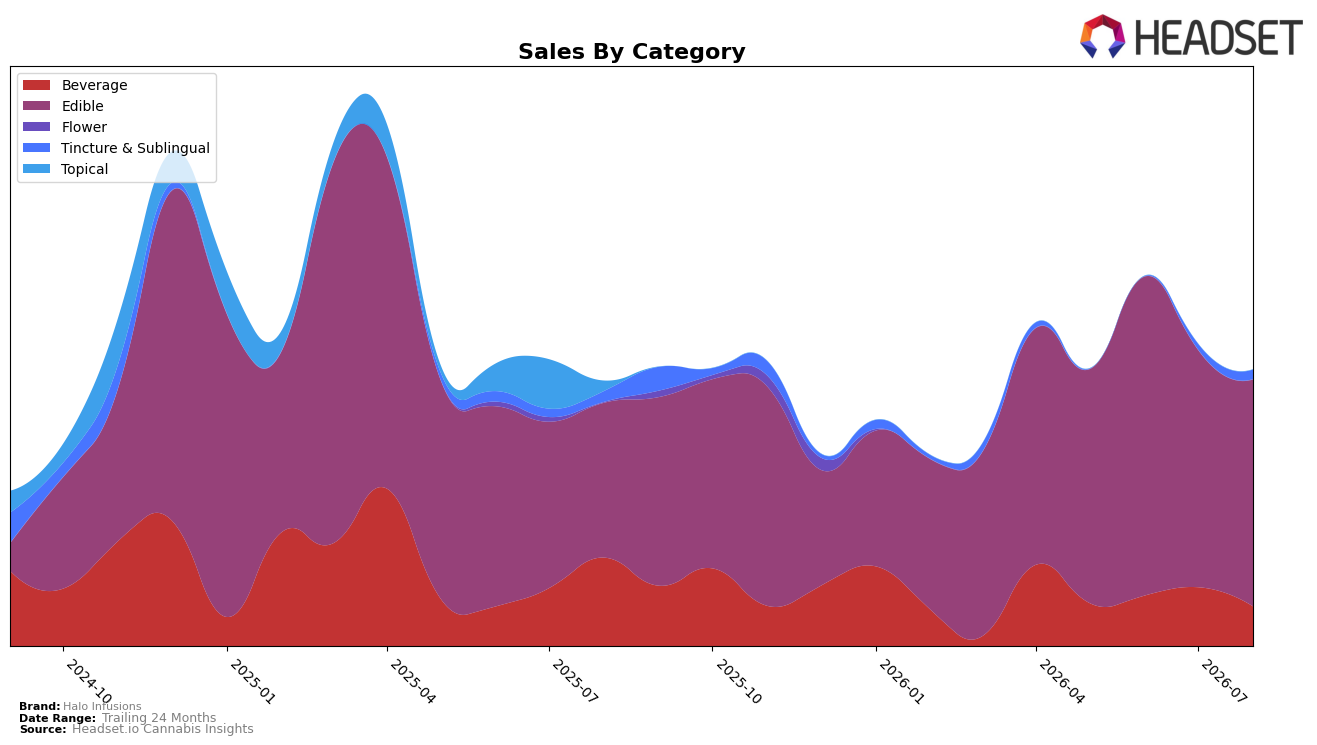
In August 2026, Halo Infusions concentrated 82.27% of sales in Edible, up on a 46.66% year-over-year basis even as month-over-month slipped 4.43%, while Beverage contracted to 14.37% share with a 55.22% YoY decline and a sharper 32.67% MoM drop. Tincture & Sublingual remained a small 3.36% share but spiked 67.63% MoM despite a 12.09% YoY decline, and the brand’s average price fell 6.74% YoY alongside overall brand sales up 4.30% YoY. With Edible strength paired to Beverage retrenchment and a Tincture & Sublingual MoM rebound, the pattern implies a pivot toward higher-volume edible formats while pruning exposure to slower-moving beverages.
The mix shift—Edible share at 82.27% alongside Beverage at 14.37% and Tincture & Sublingual at 3.36%—suggests Halo Infusions is consolidating around its highest-velocity category as price repositioning lowers average price 6.74% YoY to $10.08. The 32.67% MoM contraction in Beverage versus a 67.63% MoM surge in Tincture & Sublingual indicates resource reallocation toward niches with quicker near-term uptake, while the 4.30% YoY brand growth despite a 1.95% decline over 24 months signals a recent stabilization strategy anchored in Edible scale. Net, the brand’s positioning is trending toward value-leaning Edible dominance with selective bets in Tincture & Sublingual to diversify away from Beverage volatility.
Competitive Landscape
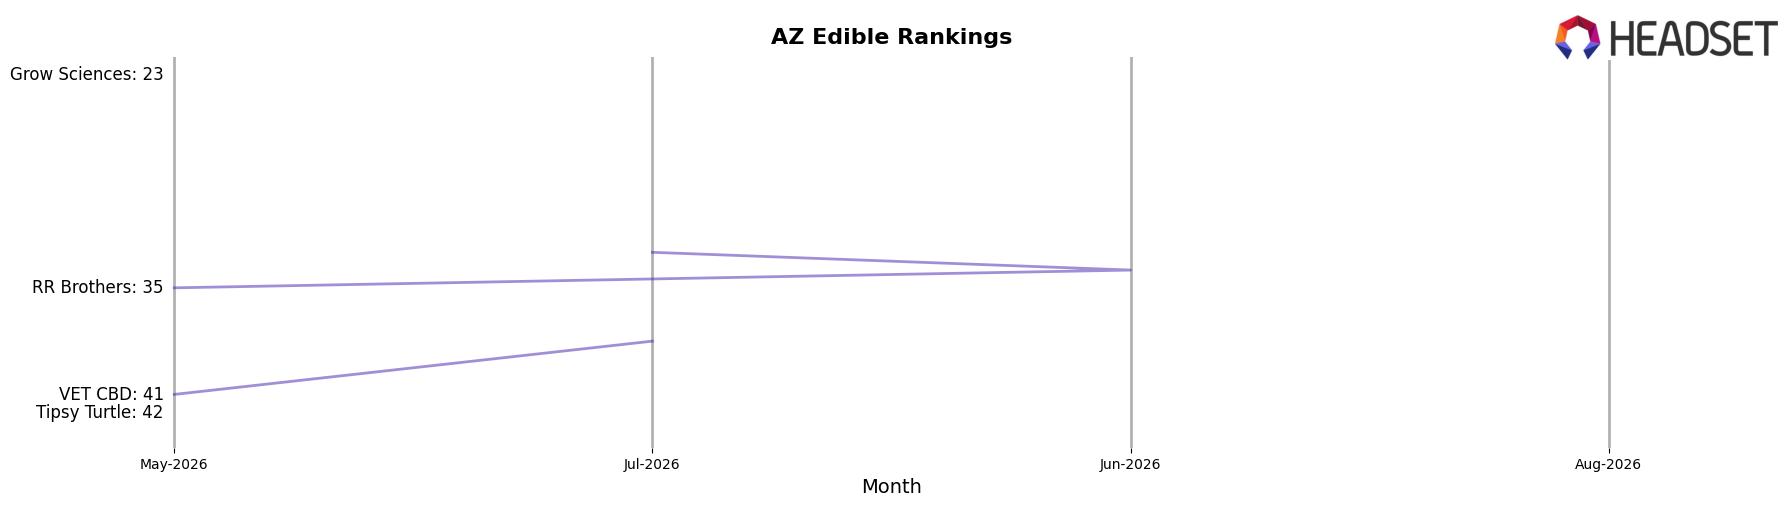
Halo Infusions ranks #43 in AZ Edible in August 2026, improving 7 positions from #50 year over year and edging up 3 spots from #46 in May 2026, indicating recent momentum against a crowded field; by contrast, Wyld held #1 with a -19.2% YoY sales change while OGEEZ stayed at #2 with +2.8% YoY growth, and Baked Bros maintained #3 with +9.5% YoY, signaling that Halo Infusions’ ascent to its peak rank of #43 in August 2026 is driven more by incremental share gains than category-wide lift, and that sustaining this rank trajectory would require converting recent position gains into consistent upward movement amid top-tier stability.
Notable Products
Classic Rice Mellow Treat (100mg) delivered the standout movement with a 95.6% month-over-month increase to roughly $1.0K and vaulted into rank 5, while Milk Chocolate Bar (100mg) slid 25.2% to rank 4. Sativa Classic Brownie (100mg) gained 17.3% to hold rank 1, whereas Indica Classic Brownie (100mg) fell 7.3% at rank 3 and Double Chocolate Chip Cookie (100mg) declined 18.3% at rank 8. With eight of the top ten in Edible formats and Beverage SKUs at ranks 6–7 posting declines of 31.6% and 30.1%, the mix is consolidating around classic edible staples rather than drinks.
Top Selling Cannabis Brands






Data for this report comes from real-time sales reporting by participating cannabis retailers via their point-of-sale systems, which are linked up with Headset’s business intelligence software. Headset’s data is very reliable, as it comes digitally direct from our partner retailers. However, the potential does exist for misreporting in the instance of duplicates, incorrectly classified products, inaccurate entry of products into point-of-sale systems, or even simple human error at the point of purchase. Thus, there is a slight margin of error to consider. Brands listed on this page are ranked in the top twenty within the market and product category by total retail sales volume.

