.svg)


Where to Buy
Happy Eddie is stocked at 54 licensed dispensaries across Maryland, Missouri, and New Jersey, 23 of them in Maryland, with the deepest coverage in Annapolis, Baltimore, Bethesda, Capitol Heights, and Cumberland. Search by ZIP code or city below to find the closest one, or filter by product type if you are after a specific format.
Market Insights Snapshot
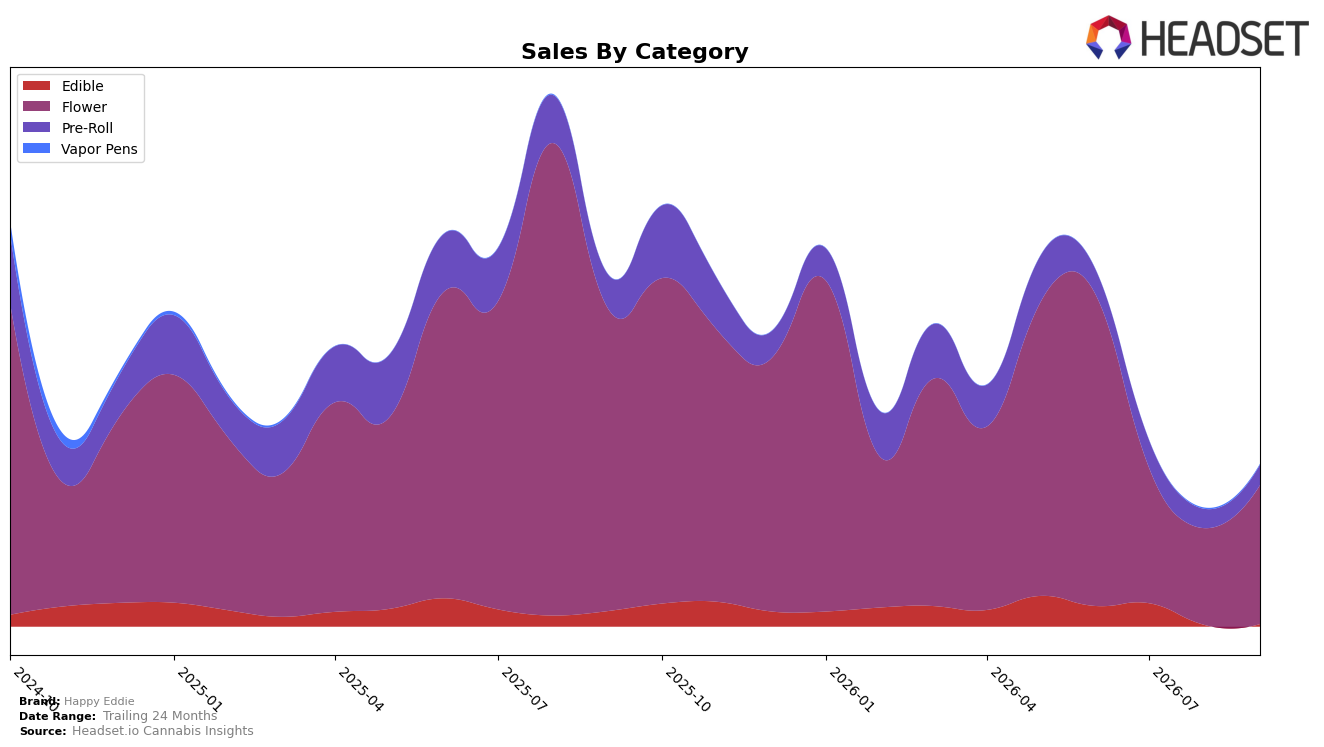
Happy Eddie concentrated 85.90% of September 2026 sales in Flower, with Flower down 54.11% year over year but up 43.61% month over month, while Pre-Roll held 12.39% share with a 41.06% YoY drop and a 5.90% MoM gain. Edible was just 1.36% share with an 85.58% YoY decline but a 76.13% MoM rebound, and Vapor Pens at 0.35% share fell 32.53% MoM with no reported YoY figure. The overall brand sales change was down 54.06% YoY alongside a 3.20% YoY rise in average price, and Flower ranked 41 in Maryland Flower, indicating a portfolio tilted toward a category with steep annual contraction but short-term recovery signals.
The mix shift implies that Happy Eddie is functionally a Flower-first brand (85.90% share) whose September 2026 momentum depends on capturing the 43.61% MoM surge in Flower while offsetting the 54.11% YoY drag, positioning it as a recovery participant rather than a diversification play. With Pre-Roll’s 12.39% share and only a 5.90% MoM lift versus Flower’s 43.61% MoM, the near-term upside skews to Flower, yet the 85.58% YoY decline in Edible and the 32.53% MoM drop in Vapor Pens cap cross-category resilience; together with a 41st rank in Maryland Flower, the pattern implies a need to defend Flower velocity while selectively reallocating toward faster-recovering niches where month-over-month comps are strengthening.
Competitive Landscape
Happy Eddie sits at rank #41 in MD Flower in September 2026, down 16 positions year over year from #25, and 14 spots below its June 2026 rank of #27; both compare unfavorably to its peak of #20 in August 2025 and to a category where SunMed held at #1 with an 11.8% YoY sales increase while RYTHM slid to #3 with a -3.6% YoY change. Against mid-pack movers, Strane climbed from #10 to #5 on a 46.0% YoY sales gain while District Cannabis fell from #2 to #4 with a -29.4% YoY decline, indicating that Happy Eddie’s 16-rank YoY drop alongside a recent 14-rank slide since June 2026 points to share being redistributed toward faster risers and away from brands with declining visibility; the trajectory implies a need to arrest multi-quarter rank erosion or risk drifting further from the #20 peak corridor where recovery is still plausible.

Notable Products
4 Degrees Pre-Roll 2-Pack (1g) led September 2026 with a month-over-month surge of 161.2% to rank 1, while Zen Wen Pre-Roll 2-Pack (1g) fell 19.6% to rank 5. Velvet Slippers Pre-Roll 2-Pack (1g) declined 25.7% at rank 8 and 64 Runtz x THC Bomb Pre-Roll 2-Pack (1g) dropped 40.4% at rank 9, meaning three Pre-Roll SKUs occupied ranks 1, 5, and 8–9 with mixed momentum. With Flower SKUs occupying ranks 2, 3, 4, and a tie at 7 but posting only a -2.9% change for 4 Degrees (3.5g) and low single-digit growth for Zen Wen (3.5g), the month’s upside was concentrated in a single Pre-Roll winner rather than broad category lift. This pattern implies Happy Eddie is pivoting toward a hero Pre-Roll driving discovery while Flower maintains shelf breadth, suggesting near-term emphasis on bundle-size and format experimentation over across-the-board strain pushes.
Top Selling Cannabis Brands






Data for this report comes from real-time sales reporting by participating cannabis retailers via their point-of-sale systems, which are linked up with Headset’s business intelligence software. Headset’s data is very reliable, as it comes digitally direct from our partner retailers. However, the potential does exist for misreporting in the instance of duplicates, incorrectly classified products, inaccurate entry of products into point-of-sale systems, or even simple human error at the point of purchase. Thus, there is a slight margin of error to consider. Brands listed on this page are ranked in the top twenty within the market and product category by total retail sales volume.

