Market Insights Snapshot
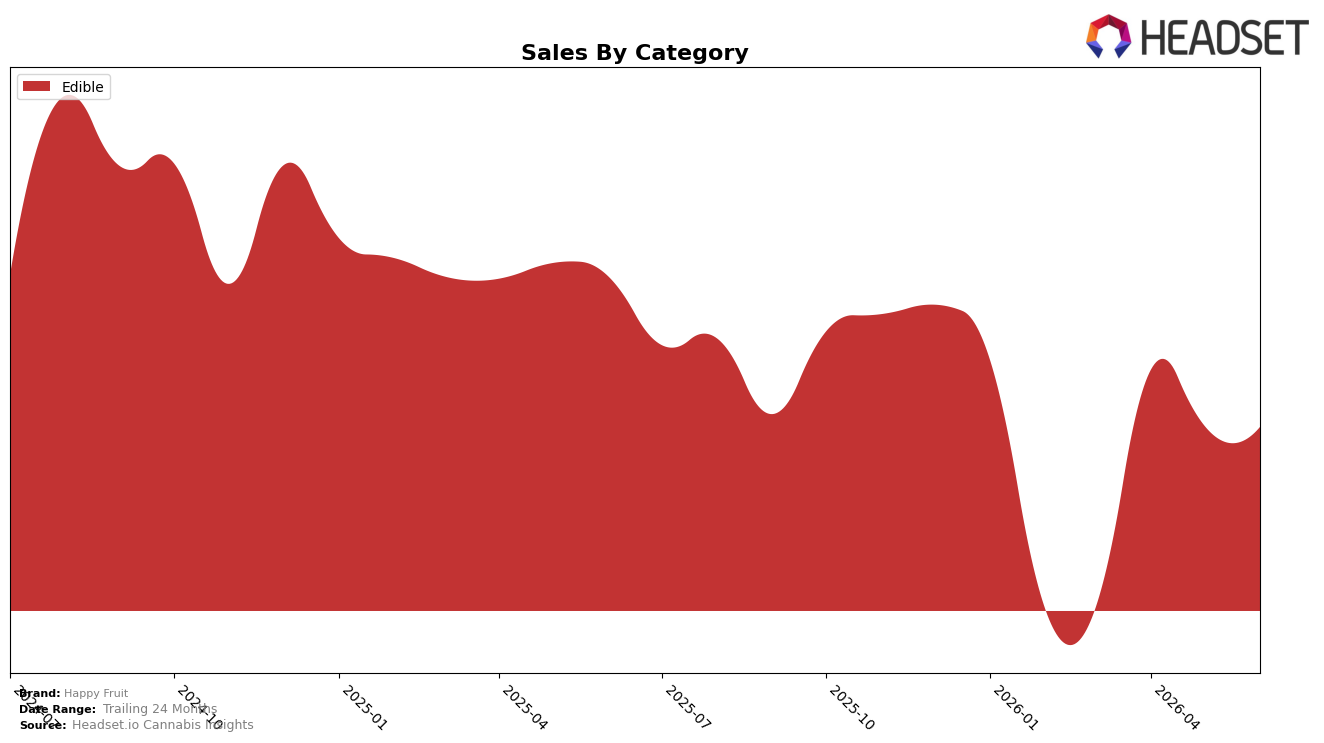
In June 2026, Happy Fruit operated as a single-category brand with Edible accounting for 100.0% of sales, while category sales fell 29.17% year over year and dipped 0.27% month over month; within that, average price declined 16.26% YoY to $12.04 and aligned with a flat MoM price trajectory implied by the minimal volume shift. The brand held rank 25 in Edible in California, pairing a double‑digit price contraction of 16.26% with a 29.17% YoY sales drop, implying unit gains were insufficient to offset price compression; the pattern indicates a discount-led strategy that did not translate into share capture despite a 0.27% MoM sales pullback and a stable single-category focus.
The mix being 100.0% Edible and the rank at 25 in California, combined with a 29.17% YoY sales decline versus a 16.26% YoY price cut, implies elasticity below one and limited trade‑down recapture, while the 0.27% MoM decline suggests stabilization rather than recovery. This configuration points to positioning that is overexposed to Edible price competition, where a 16.26% YoY price move failed to prevent a 29.17% revenue contraction and a mid‑tier rank of 25, implying the brand’s differentiation is not price-responsive and that assortment or subsegment focus within Edible must shift to regain momentum.
Competitive Landscape
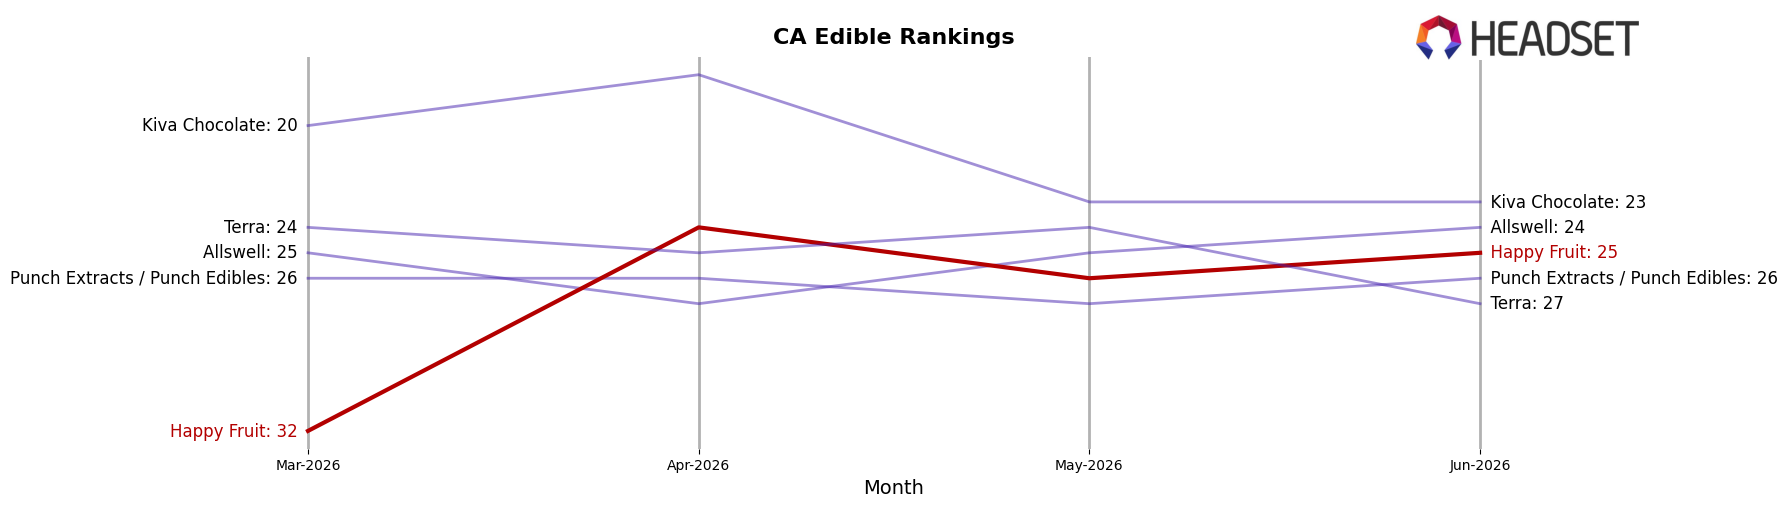
Happy Fruit sits at rank #25 in CA Edible for June 2026, down 5 positions year over year from #20 and up 7 spots versus March 2026 when it was #32, while its historical peak of #18 in February 2025 marks a 7-rank slide from that high; in contrast, Wyld held #1 with a -1.9% year-over-year sales change and Camino stayed at #2 with +12.9% sales growth, indicating that Happy Fruit’s mid-pack position is stabilizing quarter-over-quarter but underperforming leaders who are either maintaining top ranks or expanding despite mixed growth rates. The combined pattern—climbing 7 ranks since March 2026 yet sitting 5 ranks below last year—implies a recovery path driven by recent momentum but not yet reversing the longer-term rank erosion.
Notable Products
CBD/CBG/THC 1:1:1 Peaceful Pineapple Gummies 5-Pack (100mg CBD, 100mg CBG, 100mg THC) led June 2026 at rank 1 but fell 21.0% month over month while THC/CBN 2:1 Moon Berry Indica Gummies 5-Pack (100mg THC, 50mg CBN) at rank 2 dropped 13.2%. Berry Cool Solventless Rosin Gummies 5-Pack (100mg) rose 9.3% to rank 4 as Watermelon Lemonade Rosin Gummies 5-Pack (100mg) gained 3.1% at rank 3, indicating the downturn is concentrated in the leading functional SKUs rather than across the board. With four of the top five in June 2026 showing double-digit declines or single-digit gains and only one subcategory posting a near-20% rise at rank 7, the mix implies demand is rotating from multi-cannabinoid formulations toward classic rosin flavors, nudging Happy Fruit toward flavor-led positioning even as its $18,744 leader cools.
Top Selling Cannabis Brands
Data for this report comes from real-time sales reporting by participating cannabis retailers via their point-of-sale systems, which are linked up with Headset’s business intelligence software. Headset’s data is very reliable, as it comes digitally direct from our partner retailers. However, the potential does exist for misreporting in the instance of duplicates, incorrectly classified products, inaccurate entry of products into point-of-sale systems, or even simple human error at the point of purchase. Thus, there is a slight margin of error to consider. Brands listed on this page are ranked in the top twenty within the market and product category by total retail sales volume.

