.svg)

Sep-2026
Sales
Trend
6-Month
Product Count
SKUs
Avg Price
YoY Sales Change
YoY Price Change


Where to Buy
Kushy Punch is stocked at 557 licensed dispensaries across California, Missouri, and 6 other states, 239 of them in California, with the deepest coverage in Los Angeles, San Diego, La Mesa, Long Beach, and San Francisco. Search by ZIP code or city below to find the closest one, or filter by product type if you are after a specific format.
Market Insights Snapshot
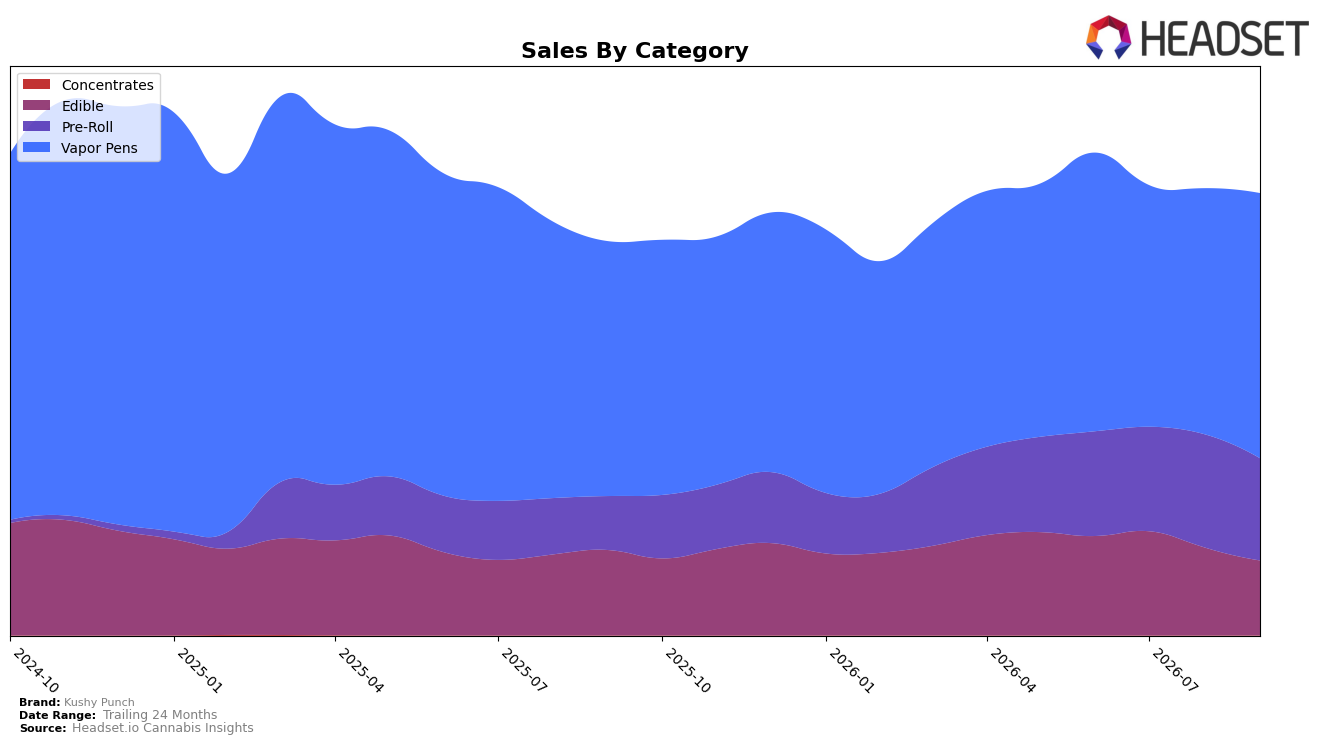
Kushy Punch concentrated 60.02% of September 2026 sales in Vapor Pens with 7.77% month-over-month growth and 4.05% year-over-year growth, while Pre-Roll expanded to 23.08% share on a 90.02% year-over-year surge but fell 9.74% month over month. Edible contracted to 16.90% share with a 12.26% year-over-year decline and a 14.83% month-over-month drop, and the brand’s average price fell 9.54% year over year to $22.13 even as total brand sales rose 12.24% year over year. In Missouri Vapor Pens, Kushy Punch sits at rank 7, and the mix tilt plus rank position imply the brand is leaning into inhalables scale while allowing Edible to recede, using pricing to defend velocity.
The combination of a 7.77% month-over-month gain in Vapor Pens and a 9.74% month-over-month dip in Pre-Roll suggests share defense in the leading category while trimming promotional exposure in the secondary one, and the 4.05% year-over-year Vapor Pens rise against a 12.26% Edible decline indicates a portfolio pivot toward faster-turn formats. With rank 7 in Missouri Vapor Pens and a brand-wide 12.24% year-over-year sales increase alongside a 9.54% average price decrease, the pattern implies Kushy Punch is trading margin for shelf position in inhalables to anchor demand, accepting near-term Edible attrition to reinforce a two-tier strategy centered on Vapor Pens scale and selective Pre-Roll expansion.
Competitive Landscape
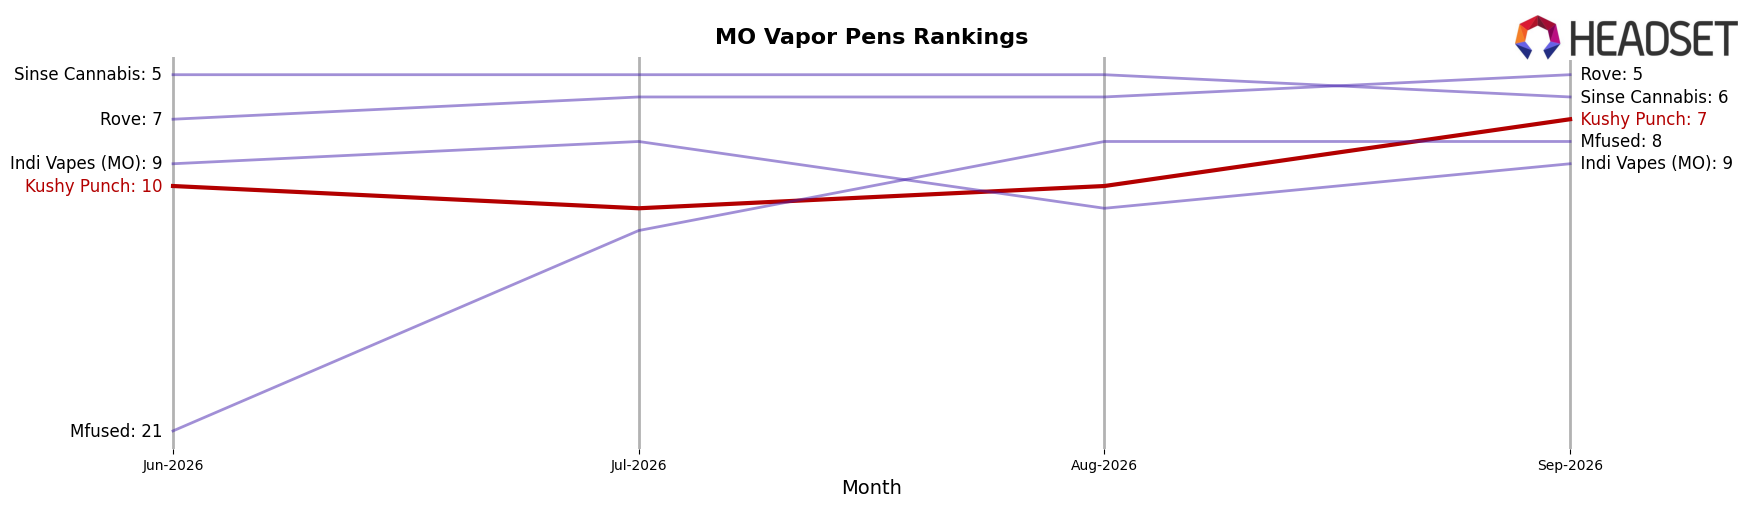
Kushy Punch sits at rank #7 in September 2026, improving 2 positions from #9 year over year and advancing 3 slots from #10 three months ago, while still trailing its peak of #2 from March 2025; in contrast, Good Day Farm climbed from #5 to #3 alongside a 35.36% YoY sales increase and Rove slid from #3 to #5 with a -4.34% YoY decline, indicating Kushy Punch’s rank gains are competitive but not yet outpacing the category’s faster risers. This pattern implies a recovery trajectory for Kushy Punch—upward in rank but still below its March 2025 ceiling—meaning sustained share capture will require acceleration faster than rivals improving 2+ positions or growing 20–35% YoY.
Notable Products
Blue Raspberry Fast Acting Gummies 10-Pack (100mg) posted the steepest shift in September 2026 at -35.1% MoM while sliding to rank 6, and the related Blue Raspberry Fast Acting Gummies 10-Pack (200mg) fell -24.3% MoM at rank 9; together with Hybrid Sour Apple Gummies 10-Pack (100mg) at rank 2 with -3.4% MoM, this places three Edible SKUs inside the top 10 but all on negative momentum. In contrast, Strawberry Rozay Infused Pre-Roll 5-Pack (2.5g) climbed +8.4% MoM to rank 3 as Vapor Pens like Strawnana Smoothie Distillate Disposable (1g) dropped -15.9% MoM to rank 10, signaling a tilt away from select disposables even as one pre-roll gains share; within this mix, Sativa Lemonade Full Specrtum Fast Acting Gummies 10-Pack (100mg) held rank 1 at -2.0% MoM with $42,380. The pattern implies Kushy Punch is relying on a single flagship gummy while fast-acting line extensions and certain disposables retrench, pushing assortment decisions toward stabilizing pre-roll growth and pruning weaker Edible variants.
Top Selling Cannabis Brands






Data for this report comes from real-time sales reporting by participating cannabis retailers via their point-of-sale systems, which are linked up with Headset’s business intelligence software. Headset’s data is very reliable, as it comes digitally direct from our partner retailers. However, the potential does exist for misreporting in the instance of duplicates, incorrectly classified products, inaccurate entry of products into point-of-sale systems, or even simple human error at the point of purchase. Thus, there is a slight margin of error to consider. Brands listed on this page are ranked in the top twenty within the market and product category by total retail sales volume.

