Market Insights Snapshot
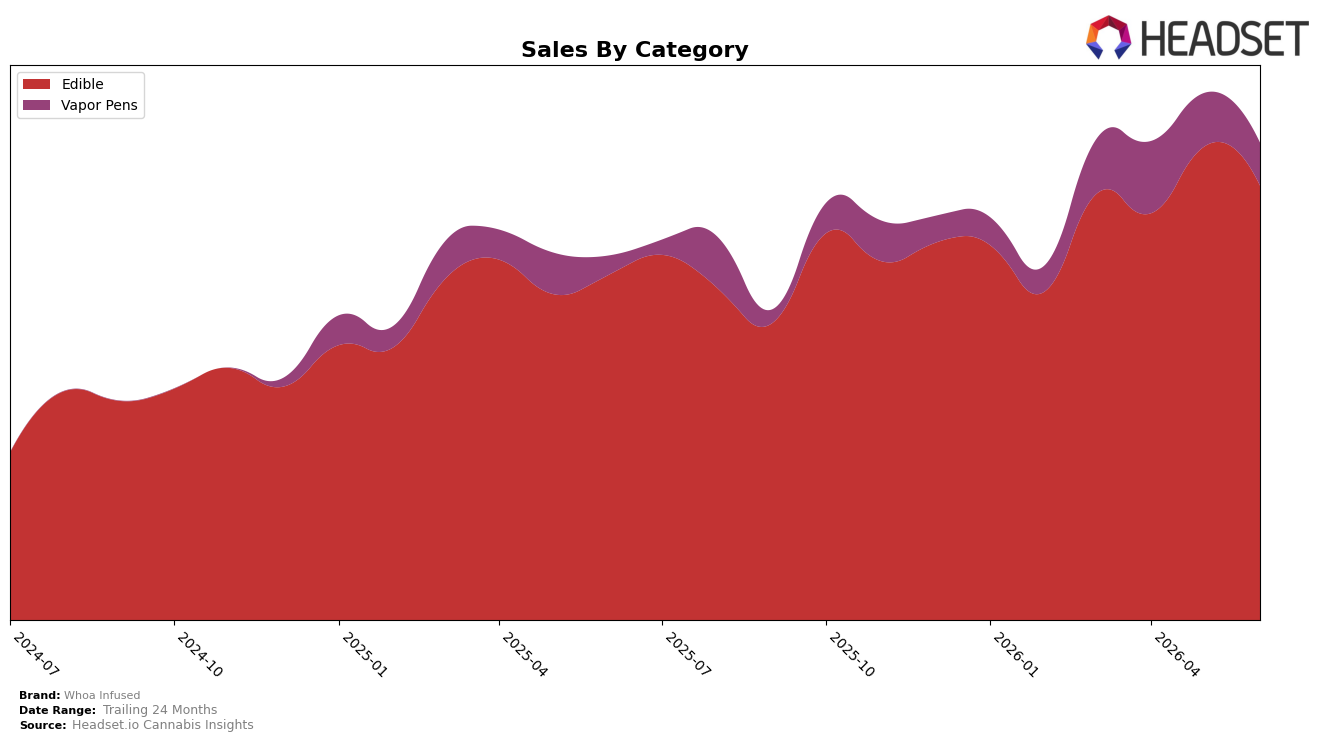
Whoa Infused concentrated 91.06% of June 2026 sales in Edible, ranking 22 in Edible within California, while Vapor Pens held 8.94% share. Year over year, Edible grew 25.95% but declined 8.30% month over month, whereas Vapor Pens jumped 122.91% YoY yet fell 19.73% MoM. With average price up 10.24% YoY to $5.75 and Vapor Pens priced 157% above Edible on a unit basis, the mix indicates a high-volume Edible core with a smaller, higher-priced Vapor Pens flank that is expanding YoY but contracting sequentially, implying sensitivity to recent shelf or promo cadence.
The mix shift implies Whoa Infused is optimized for Edible scale but depends on Vapor Pens for incremental growth, as evidenced by Edible’s 91.06% share alongside Vapor Pens’ 122.91% YoY growth. The 8.30% MoM pullback in Edible coupled with a 19.73% MoM drop in Vapor Pens suggests near-term velocity headwinds; however, maintaining a 22 rank in California Edible while average prices rose 10.24% YoY indicates pricing power without immediate share collapse. Net pattern: the brand’s positioning is anchored in Edible scale with opportunistic premiumization, and sustaining growth will hinge on stabilizing month-to-month execution while protecting Edible rank and selectively expanding higher-price Vapor Pens.
Competitive Landscape
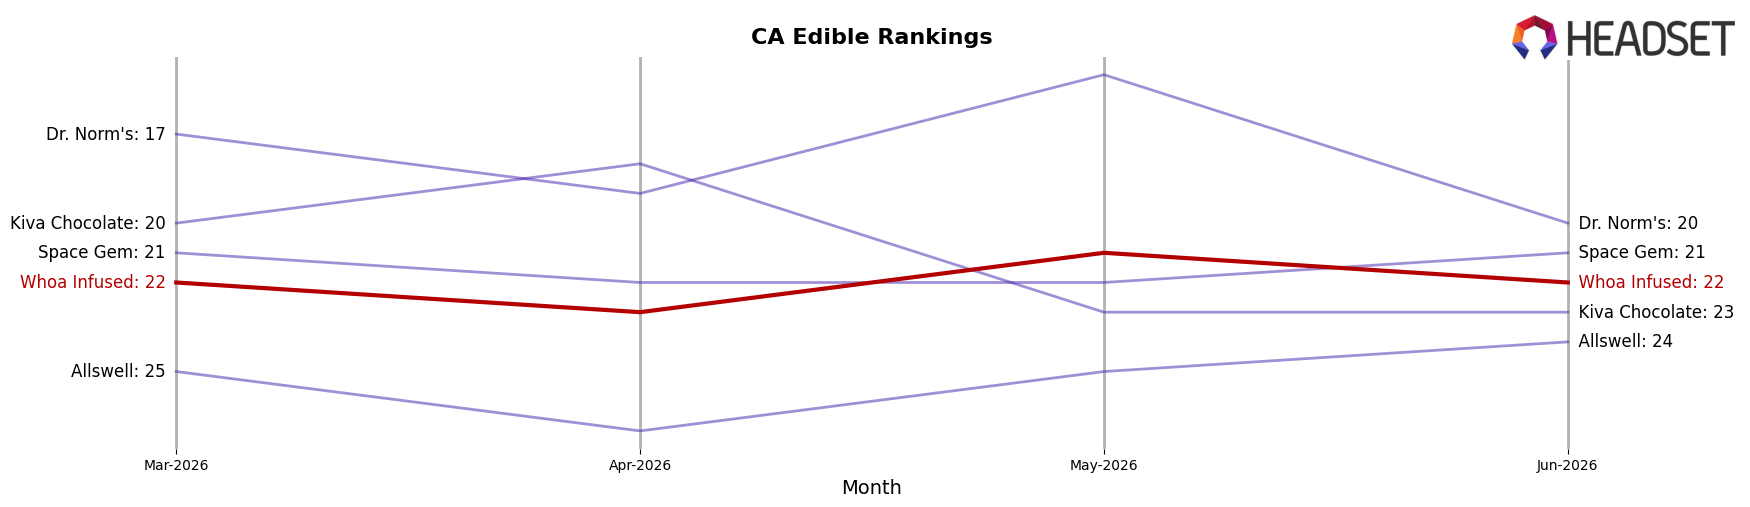
Whoa Infused sits at rank #22 in California Edible for June 2026, two spots higher than June 2025’s #24, and holding flat versus March 2026’s #22 while remaining just one position off its peak #21 from May 2026; meanwhile, category leaders moved differently, with Wyld steady at #1 despite a -1.9% year-over-year sales change and Good Tide fixed at #5 alongside a 28.5% year-over-year increase, indicating Whoa Infused gained rank through incremental share capture rather than tide-lifted growth and suggesting its trajectory points to marginal competitive wins that require conversion against faster-rising mid-tier rivals to break back above #21.
Notable Products
Blueberry Gummy (100mg) posted the steepest decline in June 2026 at -36.5% MoM while sliding to rank 9, and Strawberry Gummy (100mg) also contracted -20.1% MoM despite holding rank 1. Pineapple Con Chile Gummy (100mg) fell -27.0% MoM at rank 2, whereas Watermelon Gummy 10-Pack (100mg) was the lone mover upward at +26.8% MoM in rank 5. With all ten top SKUs in Edible and eight of the top ten registering double-digit MoM declines, the mix points to over-reliance on fruit gummy singles with softening velocity and a need to steer demand toward multi-pack formats that are still growing.
Top Selling Cannabis Brands
Data for this report comes from real-time sales reporting by participating cannabis retailers via their point-of-sale systems, which are linked up with Headset’s business intelligence software. Headset’s data is very reliable, as it comes digitally direct from our partner retailers. However, the potential does exist for misreporting in the instance of duplicates, incorrectly classified products, inaccurate entry of products into point-of-sale systems, or even simple human error at the point of purchase. Thus, there is a slight margin of error to consider. Brands listed on this page are ranked in the top twenty within the market and product category by total retail sales volume.

