Jun-2026
Sales
Trend
6-Month
Product Count
SKUs
Avg Price
YoY Sales Change
YoY Price Change
Market Insights Snapshot
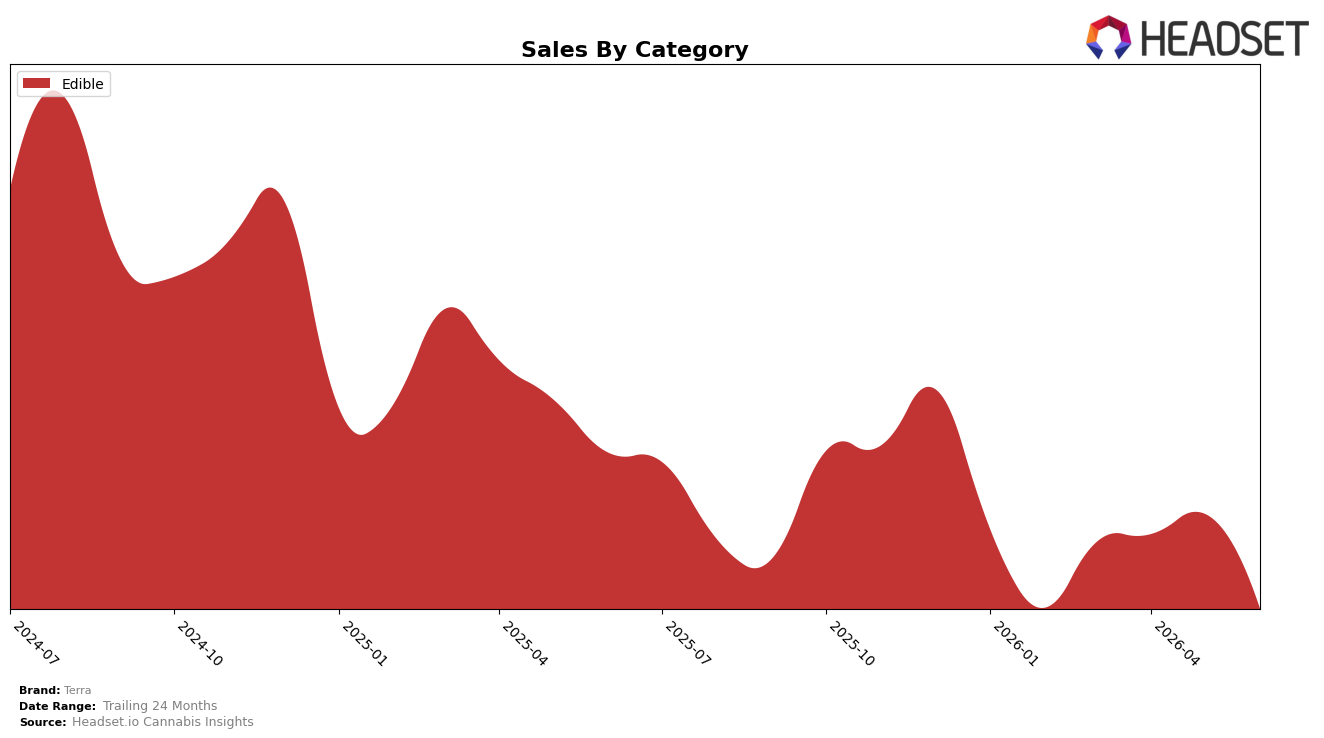
In June 2026, Terra’s category mix concentrated entirely in Edible at 100.0% share, with Edible sales down 22.36% year over year and 14.90% month over month, while the average price in Edible rose 1.04% YoY to $17.53. Within California Edibles, Terra held rank 27, indicating a mid-pack position even as all volume is tied to a single category; the combination of a 22.36% YoY sales decline alongside a 1.04% YoY price uptick suggests elasticities are unfavorable at current price points. The pattern implies Terra’s single-category exposure magnifies downside from category-specific softness and that price firmness amid falling volume is likely suppressing unit throughput.
With a 100.0% reliance on Edibles and a rank of 27 in California, Terra’s positioning skews toward defending share within a crowded middle tier rather than expanding breadth across categories. The 14.90% MoM drop paired with a 22.36% YoY decline, against a 1.04% YoY price increase, implies the brand is trading off velocity for margin and ceding rank headroom to competitors that undercut on price or diversify mix; the strategic implication is that Terra’s current stance prioritizes price stability over unit growth, leaving limited cushion if Edible category demand softens further.
Competitive Landscape
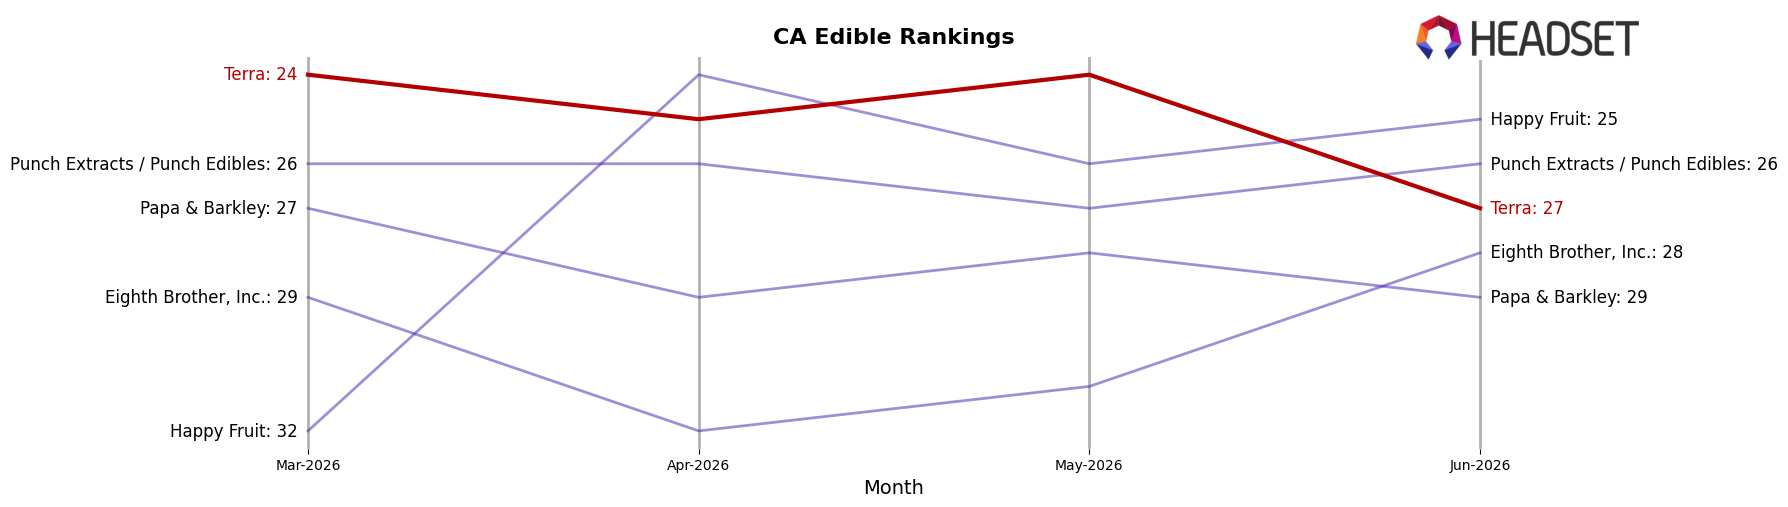
Terra sits at rank #27 in CA Edible for June 2026, down 2 positions year over year from #25 and 3 spots below its three-month level of #24, while remaining 7 positions off its peak of #20 from June 2024; by contrast, Wyld held #1 year over year at #1 despite a -1.9% sales change and Camino maintained #2 with a +12.9% sales lift, indicating Terra’s relative slippage is more about stagnant share against leaders than broad market contraction, and the trajectory implies Terra is trending toward the lower third of the leaderboard unless mix or velocity reverses the two-rank YoY decline.
Notable Products
The steepest decline came from THC/CBN 5:2 Milk And Cookies Chocolate Bites 20-Pack (100mg THC, 40mg CBN), down 30.8% month over month and slipping to rank 4, while the broader CBN line also weakened with the 5:1 variant at rank 8 after a 46.0% drop. Dark Chocolate Espresso Bean Bites 20-Pack (100mg) held rank 1 despite a 6.8% decline, and Blueberry Milk Chocolate Bites 20-Pack (100mg) stayed at rank 2 with a 9.6% pullback, indicating core classics are contracting less severely than sleep-oriented extensions. With four of the top five SKUs in the 20-Pack chocolate bites family and all posting double-digit or near double-digit declines, category concentration is amplifying downside as fewer formats carry the portfolio. The pattern implies Terra is leaning on legacy chocolate multipacks while need-state variants soften, suggesting a near-term pivot toward defending flagship bites and reassessing CBN-heavy mixes.
Top Selling Cannabis Brands
Data for this report comes from real-time sales reporting by participating cannabis retailers via their point-of-sale systems, which are linked up with Headset’s business intelligence software. Headset’s data is very reliable, as it comes digitally direct from our partner retailers. However, the potential does exist for misreporting in the instance of duplicates, incorrectly classified products, inaccurate entry of products into point-of-sale systems, or even simple human error at the point of purchase. Thus, there is a slight margin of error to consider. Brands listed on this page are ranked in the top twenty within the market and product category by total retail sales volume.

