.svg)

Sep-2026
Sales
Trend
6-Month
Product Count
SKUs
Avg Price
YoY Sales Change
YoY Price Change


Where to Buy
#Hash is stocked at 66 licensed dispensaries across New York, California, and 4 other states, 27 of them in New York, with the deepest coverage in New York, Queens, Albany, Binghamton, and Brooklyn. Search by ZIP code or city below to find the closest one, or filter by product type if you are after a specific format.
Market Insights Snapshot
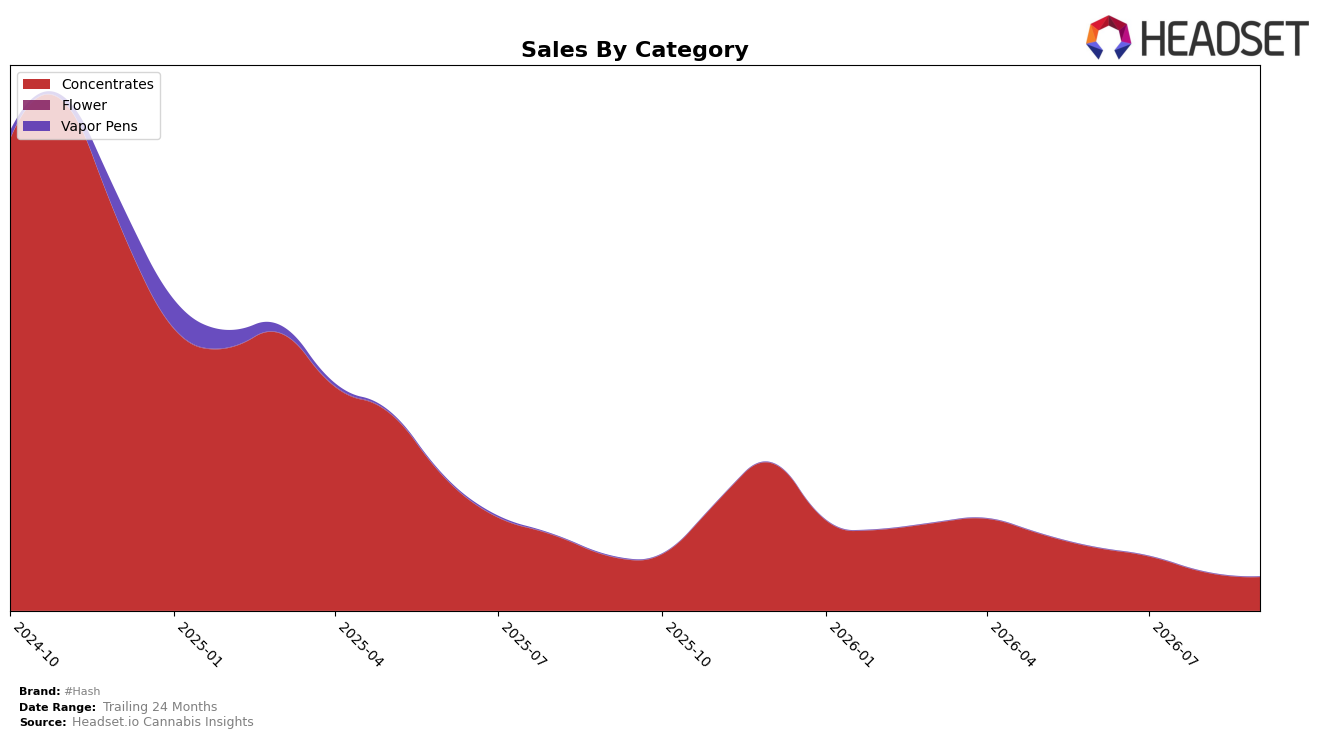
In September 2026, #Hash operated as a single-category brand, with Concentrates accounting for 100.0% of sales, down 12.6% month over month and 38.7% year over year. The brand’s overall sales declined 39.1% year over year alongside a 15.7% drop in average price to $27.46, placing #Hash at rank 12 in Concentrates in New York. This concentration plus simultaneous volume and pricing pressure implies the brand is overexposed to a contracting pocket of demand, where a one-channel dependency converts category softness directly into share and rank risk.
The September 2026 shifts indicate #Hash’s positioning is tethered to price-sensitive Concentrates buyers: a 15.7% price compression alongside a 12.6% monthly sales dip and a 38.7% annual category decline suggests discounting is not translating into sufficient unit lift to defend rank 12. With 100.0% mix in Concentrates and a 39.1% brand-level annual decline, the brand’s current footing implies a need to either push mix into higher-velocity niches within Concentrates or diversify mix to reduce the direct linkage between category drawdown and rank exposure in New York.
Competitive Landscape
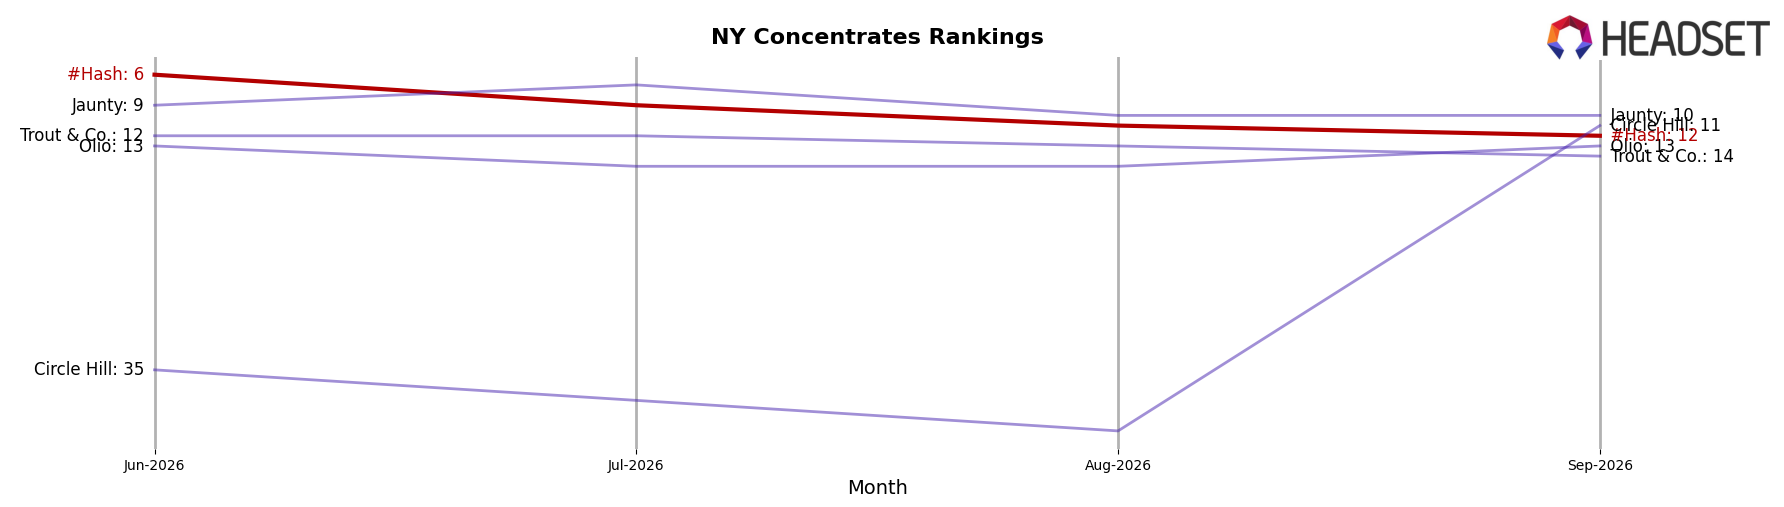
#Hash sits at rank #12 in New York Concentrates in September 2026 after sliding 5 positions year over year from #17 to #12, and falling 6 places since June 2026 when it was #6; this contrasts with Mfny (Marijuana Farms New York) holding #1 both year over year and currently, and with RYTHM advancing from #4 to #2 while Jetpacks eased from #2 to #3. The category’s leadership is being reinforced by double-digit growth at the top—RYTHM’s sales grew 43.7% year over year and Nyce at #5 expanded 76.3%—while UMAMII’s jump from #21 to #4 alongside a 680.1% sales increase pressures mid-tier positions; taken together, the mix of a 5-rank YoY decline for #Hash and a 6-rank drop since June 2026 implies a transition from prior peak exposure (last seen at #1 in April 2025) to a share-defense phase where regaining top-10 status requires countering faster-moving rivals.
Notable Products
Orange Cookies Budder Wax (1g) posted the steepest decline at -16.9% MoM while falling to rank 5, and Garlicane Sugar Wax (1g) slid -37.9% MoM despite holding a tied rank 7; this contrast with Strawberry OG Cookies Budder Wax (1g) rising +19.4% to rank 1 signals volatility concentrated in flavor-driven waxes. Strawberry OG Cookies Budder Wax (1g) at rank 1 and Larry Burger Brittle Sugar Wax (1g) up +23.5% to rank 3 anchor a top five where four of the top ten are Budder Wax SKUs, suggesting consumer migration toward budder formats even as select sugar waxes contract. Larry Burger Budder Wax (1g) eased -6.2% MoM at rank 2 while the category still skews toward mid-priced 1g concentrates around $5,759 in top-SKU revenue, indicating rotation within a stable ticket rather than a trade-down. Net pattern: momentum is consolidating in budder-led strains, implying #Hash can lean into budder innovation while pruning underperforming sugar wax variants.
Top Selling Cannabis Brands






Data for this report comes from real-time sales reporting by participating cannabis retailers via their point-of-sale systems, which are linked up with Headset’s business intelligence software. Headset’s data is very reliable, as it comes digitally direct from our partner retailers. However, the potential does exist for misreporting in the instance of duplicates, incorrectly classified products, inaccurate entry of products into point-of-sale systems, or even simple human error at the point of purchase. Thus, there is a slight margin of error to consider. Brands listed on this page are ranked in the top twenty within the market and product category by total retail sales volume.

