Jun-2026
Sales
Trend
6-Month
Product Count
SKUs
Avg Price
YoY Sales Change
YoY Price Change
Market Insights Snapshot
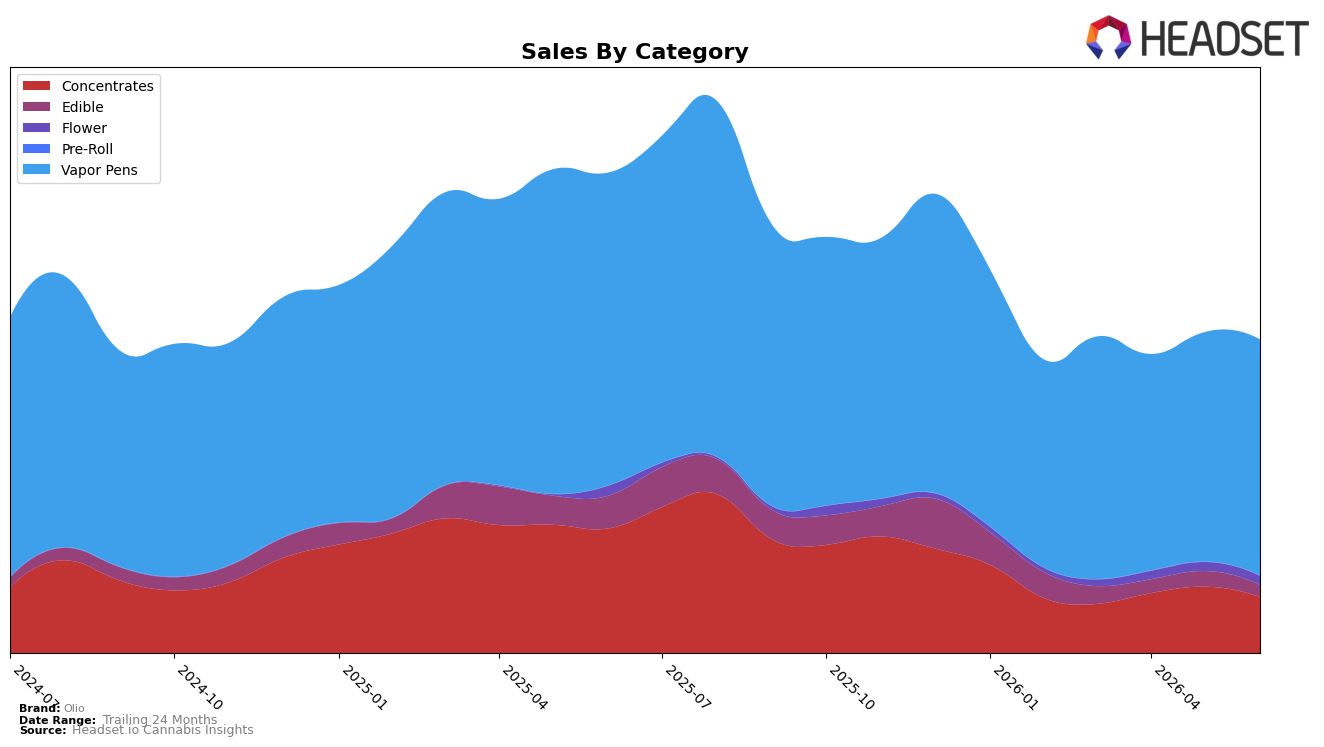
In June 2026, Olio concentrated 75.52% of sales in Vapor Pens with a month-over-month gain of 2.88% but a year-over-year decline of 24.56%, while Concentrates held 17.91% share with a 15.54% MoM drop and a 55.10% YoY slide. The smaller formats contracted faster: Edible sat at 3.75% share with MoM down 23.58% and YoY down 63.86%, and Flower at 2.82% share eked out a 1.23% MoM uptick against an 8.63% YoY decline. With Vapor Pens anchoring volume and showing the only material MoM expansion alongside a 0.22% YoY rise in brand-average price, the pattern implies reliance on a single growth-capable category to offset deeper pullbacks in secondary lines.
Given Vapor Pens rank 14 in Colorado and comprise 75.52% of mix, incremental share gains likely depend on sustaining the 2.88% MoM momentum in pens while arresting the 15.54% MoM contraction in Concentrates and the 23.58% MoM slide in Edible. The divergence—Vapor Pens stabilizing versus double-digit MoM declines elsewhere—suggests positioning as a pen-led brand, where tightening assortment in lagging categories and leaning into pen price points near $36.21 could reduce the 34.83% YoY brand sales decline and create headroom to climb from rank 14 without requiring broad-based category recovery.
Competitive Landscape
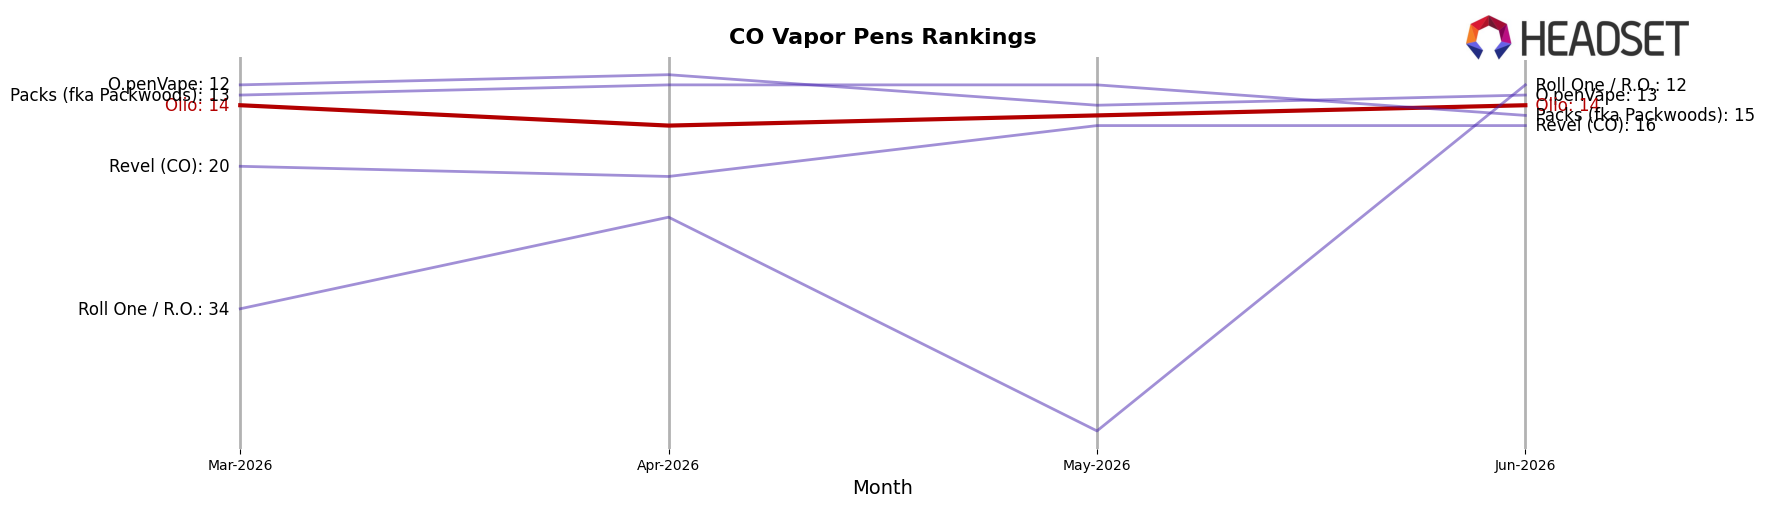
Olio is currently ranked #14 in CO Vapor Pens in June 2026, down 5 positions year over year from #9, and flat versus March 2026 at #14; the brand’s peak of #7 in August 2025 contrasts with the current trough by 7 ranks, indicating slippage rather than short-term volatility. Competitively, Spherex held #1 while its sales fell 9.6% year over year, PAX climbed from #3 to #2 with a 22.5% sales increase year over year, and Spectra jumped from #11 to #4 with 113.1% sales growth year over year, underscoring that share is consolidating among faster-rising rivals even as some leaders contract; the implication is that Olio’s rank trajectory—down 5 spots YoY and unchanged over the last three months—signals a need to counter accelerating mid-tier ascents rather than only chasing the top spot.
Notable Products
Fresh Squeeze Live Resin Cartridge (1g) posted the steepest decline in June 2026 at -48.1% while dropping to rank 7, and Gas Tanker Live Rosin Cartridge (0.5g) fell -24.1% to rank 9; this split contrasts with Coolio B-bud (7g) rising +19.3% to rank 1. White Truffle Live Rosin Cartridge (0.5g) advanced +32.5% into rank 2 as Sour Blue Raspberry Rosin Gummies 10-Pack (100mg) slid -31.0% to rank 6, indicating a rotation within formats rather than a category-wide pullback. Four of the top ten are Vapor Pens SKUs, yet the only dollar leader was the Flower item at $18,183, implying share is consolidating at the format level while leadership is tilting toward higher-volume Flower. The pattern implies Olio is leaning into a two-pillar mix where Flower anchors rank leadership as select Live Rosin cartridges capture momentum, while weaker resin SKUs are candidates for pruning or reformulation.
Top Selling Cannabis Brands
Data for this report comes from real-time sales reporting by participating cannabis retailers via their point-of-sale systems, which are linked up with Headset’s business intelligence software. Headset’s data is very reliable, as it comes digitally direct from our partner retailers. However, the potential does exist for misreporting in the instance of duplicates, incorrectly classified products, inaccurate entry of products into point-of-sale systems, or even simple human error at the point of purchase. Thus, there is a slight margin of error to consider. Brands listed on this page are ranked in the top twenty within the market and product category by total retail sales volume.

