Jun-2026
Sales
Trend
6-Month
Product Count
SKUs
Avg Price
YoY Sales Change
YoY Price Change
Market Insights Snapshot
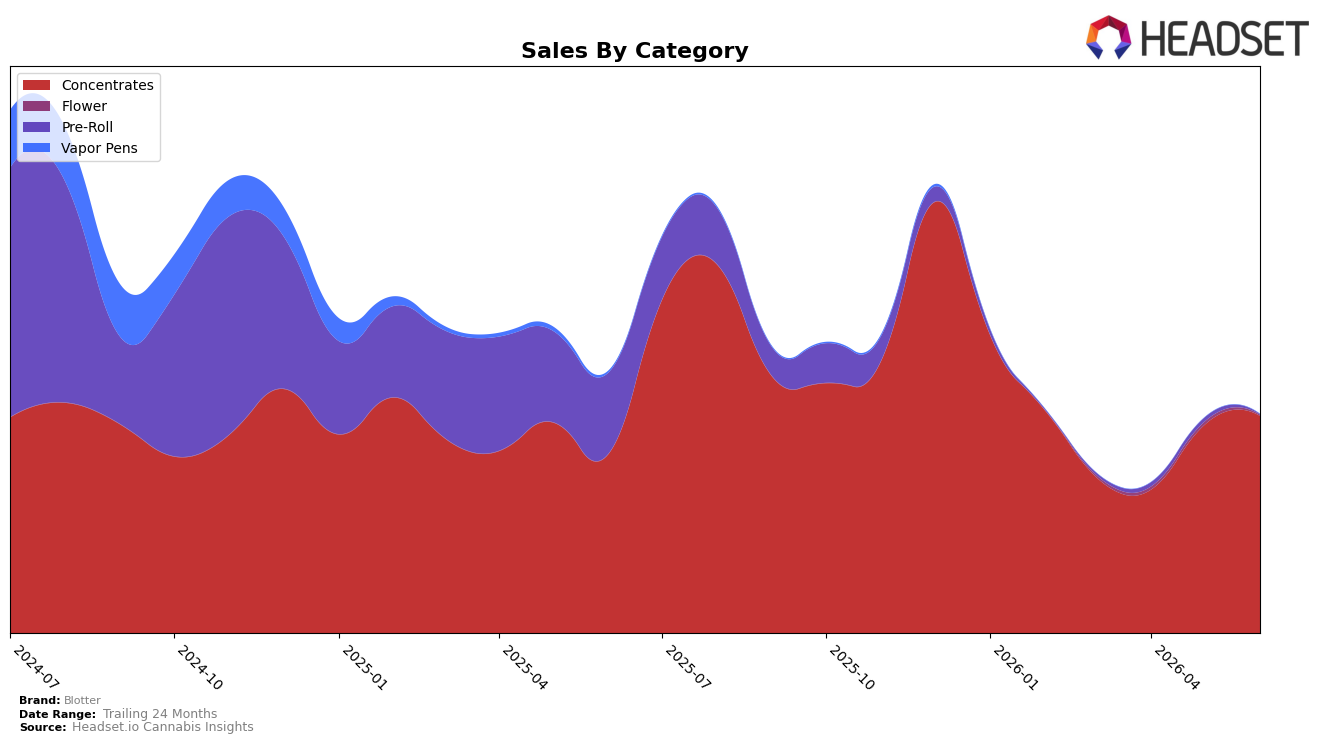
Blotter concentrated its mix in Concentrates at 99.50% share, with June 2026 sales in that category up 21.60% year over year and 4.28% month over month, while Pre-Roll collapsed 99.62% year over year and 92.00% month over month to just 0.14% share. Flower slipped to 0.36% share with a 72.45% month-over-month drop and no year-over-year comparison, and the brand’s average price fell 26.56% year over year to $38.11 even as total brand sales declined 16.48% year over year. The pattern implies Blotter is trading breadth for depth in Concentrates, using lower prices and a tighter portfolio to offset declines elsewhere and stabilize month-on-month momentum.
Within New York Concentrates, Blotter sits at rank 11, pairing a 4.28% month-over-month lift in its core category with a 72.45% month-over-month contraction in Flower, which reduces multi-category reach but may concentrate ranking gains where the brand already competes. With 99.50% of sales anchored in Concentrates and a 21.60% year-over-year rise in that category against a 16.48% year-over-year decline for the brand overall, positioning skews toward specialist status: the mix bets that share capture within one aisle can compensate for wider-category retreat and that rank 11 can be improved by prioritizing depth over diversification.
Competitive Landscape
Blotter sits at rank #11 in New York Concentrates for June 2026, unchanged YoY from #11, and up 1 position from #12 three months ago; against that stability, the brand’s historical ceiling of #3 in August 2024 contrasts with its current mid-pack placement. Competitive movement is faster above: Jetpacks climbed from #4 to #2 while UMAMII surged from #26 to #3, and Mfny (Marijuana Farms New York) held #1 with a 70.1% YoY sales lift, indicating share is consolidating higher in the table as RYTHM advanced from #7 to #4 alongside a 97.6% YoY sales increase. With peers making multi-rank gains while Blotter posts a 0-rank YoY change and only a 1-position improvement versus March 2026, the pattern implies a need to regain velocity to re-approach its prior #3 peak as upward mobility is being captured by faster-rising rivals.

Notable Products
Jam Band Cured Resin Sap (1g) posted the largest movement in June 2026 with a 212.5% month-over-month surge to rank 3, while Grasshopper Glue Cured Resin (1g) climbed 176.7% MoM to rank 1. In contrast, Biscotti Live Resin Budder (1g) fell 58.3% MoM to rank 8 and Biscotti Cured Live Resin Badder (1g) dropped 50.4% MoM to rank 9. Eight of the top ten are Concentrates SKUs within cured or live resin formats, concentrating demand around a narrow texture set and implying Blotter is consolidating share by elevating a few fast-rising cured resin variants while letting underperforming live resin lines recede.
Top Selling Cannabis Brands
Data for this report comes from real-time sales reporting by participating cannabis retailers via their point-of-sale systems, which are linked up with Headset’s business intelligence software. Headset’s data is very reliable, as it comes digitally direct from our partner retailers. However, the potential does exist for misreporting in the instance of duplicates, incorrectly classified products, inaccurate entry of products into point-of-sale systems, or even simple human error at the point of purchase. Thus, there is a slight margin of error to consider. Brands listed on this page are ranked in the top twenty within the market and product category by total retail sales volume.

