Jun-2026
Sales
Trend
6-Month
Product Count
SKUs
Avg Price
YoY Sales Change
YoY Price Change
Market Insights Snapshot
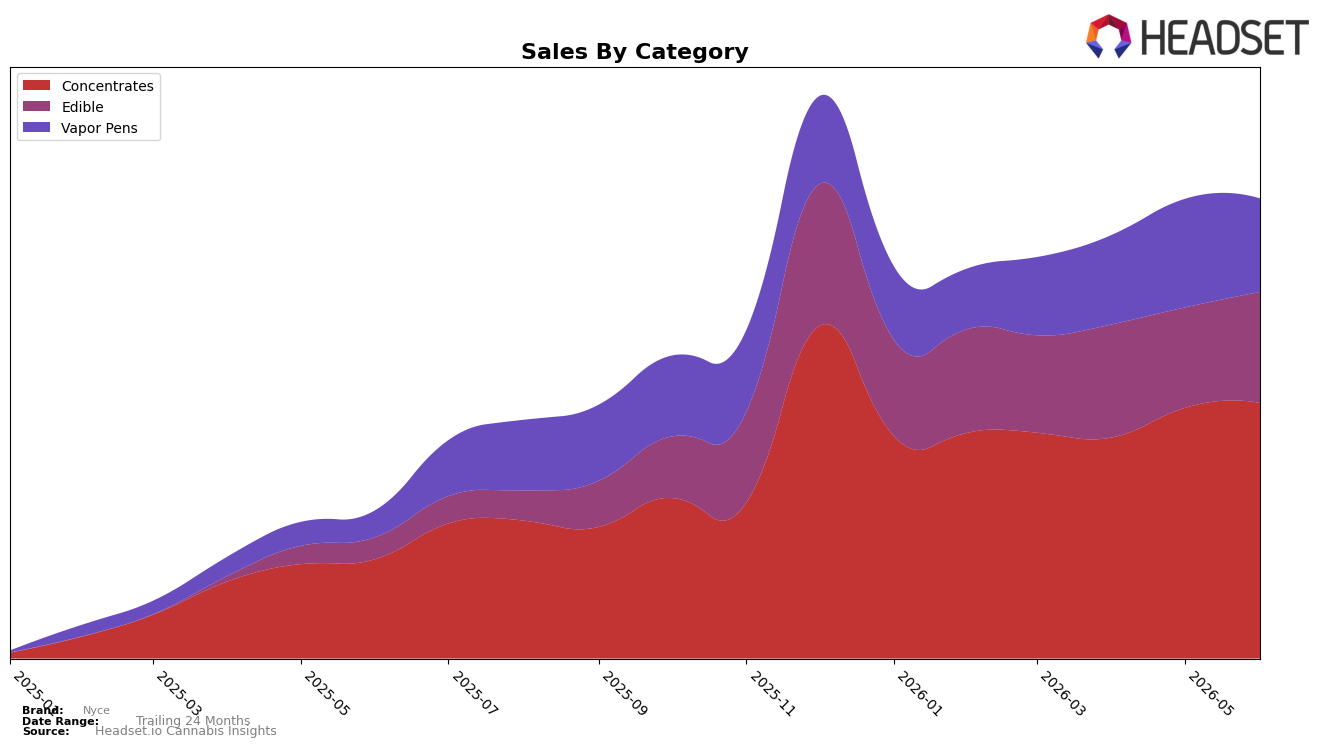
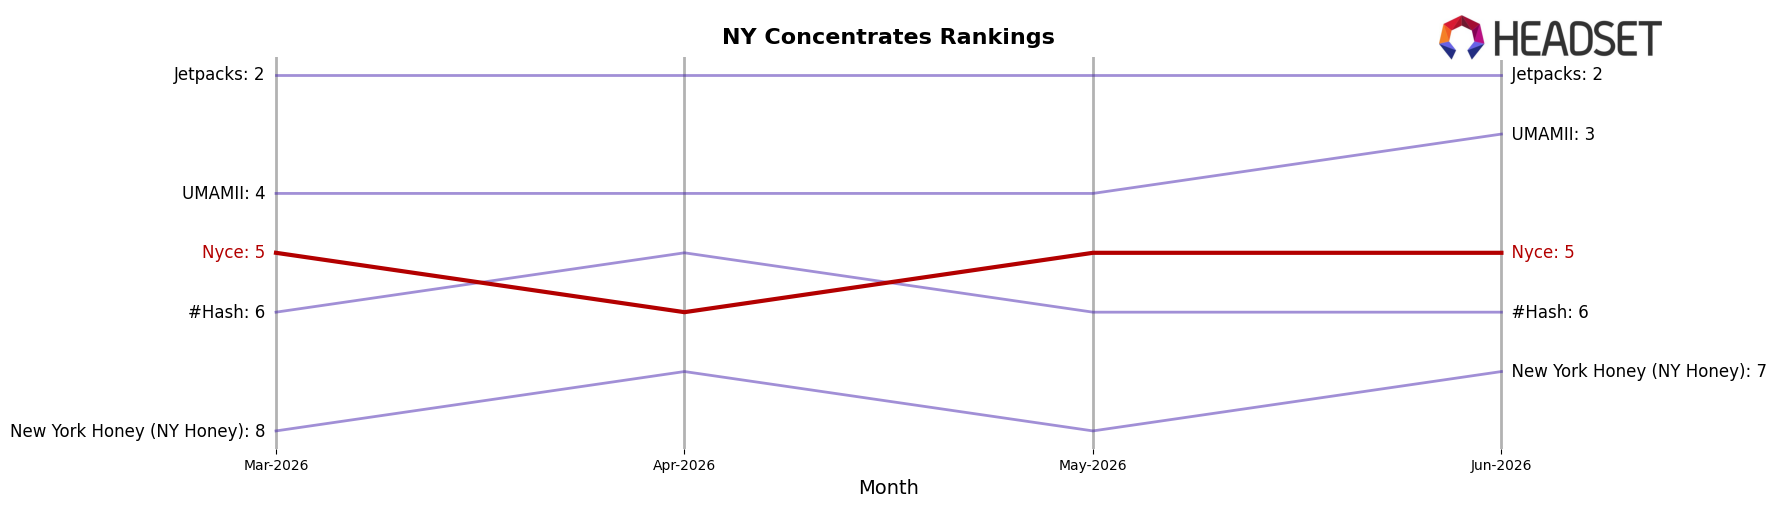
In June 2026, Nyce’s mix concentrated around Concentrates at 55.60% share with 2.02% MoM growth and 157.31% YoY growth, while Edible held 24.08% share with 10.37% MoM and 408.64% YoY, and Vapor Pens accounted for 20.32% share with -13.83% MoM but 248.65% YoY. The brand’s average price fell 16.72% YoY to $37.50 even as total brand sales rose 210.84% YoY, and Concentrates carried a $53.97 average versus Edible at $20.79, indicating a price-mix barbell. Nyce ranked 5 in Concentrates in New York, and with Concentrates up 2.02% MoM against Vapor Pens down 13.83% MoM, the category tilt is consolidating around high-velocity Concentrates and fast-growing Edible rather than Vapor Pens.
The pattern implies a repositioning toward potency-led and value-accessible formats: Concentrates’ 55.60% share and 157.31% YoY paired with Edible’s 408.64% YoY on a 24.08% share signal a two-lane strategy, while the -16.72% brand-wide price change undercuts Vapor Pens’ -13.83% MoM drag by steering volume into categories with higher YoY elasticity. Holding rank 5 in New York Concentrates while Edible expands 10.37% MoM suggests promotional or pack-architecture shifts are converting price decreases into share stability in Concentrates and incremental share capture in Edible, which implies Nyce should allocate assortment and marketing toward Concentrates leadership and Edible expansion while treating Vapor Pens as a secondary, margin-managed line.
Competitive Landscape
Nyce sits at rank #5 in New York Concentrates in June 2026, improving 5 positions year over year from #10, while holding steady versus March 2026 at #5; this stability contrasts with RYTHM rising from #7 to #4 and Jetpacks climbing from #4 to #2 as their sales grew 97.6% and 61.8% year over year respectively, and UMAMII leaping from #26 to #3 alongside a 1,648.3% sales increase. Nyce’s peak at #4 in February 2026 and current #5 position versus Mfny (Marijuana Farms New York) holding #1 with a 70.1% YoY sales lift indicate that incremental rank gains are feasible but require outpacing faster-moving rivals; the trajectory points to a plateau risk without a step-change in velocity.
Notable Products
Garlic Cocktail Live Hash Rosin (1g) posted the steepest decline in June 2026 at -30.1% and sat at rank 7, while GMO x Oreoz Cold Cure Live Hash Rosin (1g) fell -21.4% at rank 6; in contrast, Blueberry Sugar Free Live Hash Rosin Gummies 10-Pack (100mg) rose +21.1% to rank 1. Four of the top ten are Edible SKUs clustered at ranks 1–3 and 8–9, with Peach Live Hash Rosin Gummies 10-Pack (100mg) slipping -5.9% at rank 2 and Tangerine Solventless Hash Rosin Gummies 10-Pack (100mg) dropping -11.6% at rank 3, implying mix is tilting toward gummies even as flavors reshuffle. Within Concentrates, Honey Banana Live Hash Rosin (1g) advanced +26.2% at rank 5 against a -30.1% to -21.4% pullback for peers, and Papaya Mimosa Cold Cure Live Hash Rosin (1g) in rank 4 edged +3.6% on $36,502, indicating the category is consolidating around fewer winners. The pattern signals Nyce is leaning into Edibles for rank leadership while Concentrates concentrate share in select SKUs, a shift that prioritizes flavor-led gummy velocity over breadth in dabbable variants.
Top Selling Cannabis Brands
Data for this report comes from real-time sales reporting by participating cannabis retailers via their point-of-sale systems, which are linked up with Headset’s business intelligence software. Headset’s data is very reliable, as it comes digitally direct from our partner retailers. However, the potential does exist for misreporting in the instance of duplicates, incorrectly classified products, inaccurate entry of products into point-of-sale systems, or even simple human error at the point of purchase. Thus, there is a slight margin of error to consider. Brands listed on this page are ranked in the top twenty within the market and product category by total retail sales volume.

