
Sep-2026
Sales
Trend
6-Month
Product Count
SKUs
Avg Price
YoY Sales Change
YoY Price Change


Is this your brand?
See your full sales and distribution data: where you sell, how you're priced, and how you rank against the brands next to you on the shelf.
See your brand's dataCarry this brand in your store?
Headset Retailer is free. Connect your POS and see what's selling and what's sitting.
Sign up freeWhere to Buy
Haze (CO) is stocked at 28 licensed dispensaries across Colorado, with the deepest coverage in Denver, Colorado Springs, Golden, Louisville, and Pueblo West. Search by ZIP code or city below to find the closest one, or filter by product type if you are after a specific format.
Market Insights Snapshot
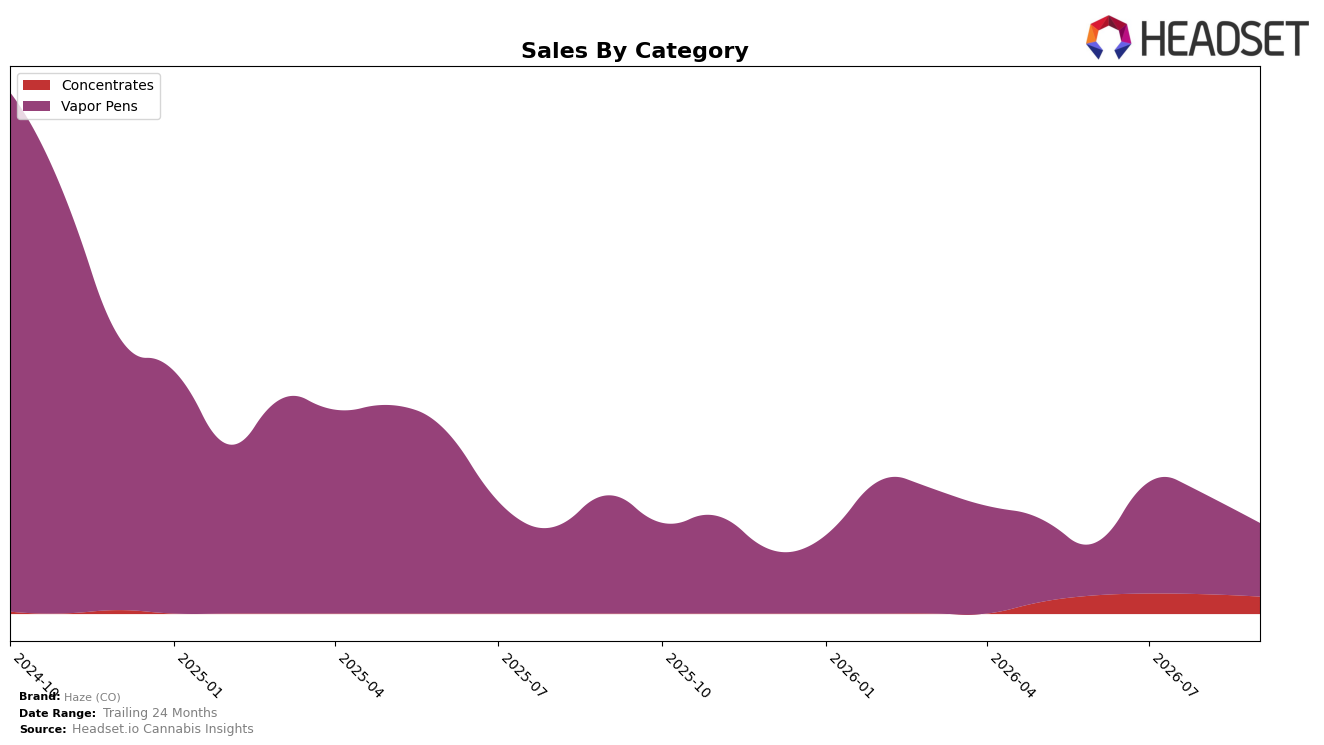
In September 2026, Haze (CO) concentrated 81.17% of sales in Vapor Pens, with the remainder 18.83% in Concentrates, while overall brand sales fell 23.48% year over year and average price declined 5.82%. Within Vapor Pens, sales contracted 37.90% YoY and 26.64% MoM, whereas Concentrates posted a 12.37% MoM decline and no year-over-year read, implying a smaller but relatively steadier segment than the core pen business. In Colorado, the Vapor Pens category rank sat at 54, aligning with the double-digit pullback and indicating a downshift in competitive standing for the brand’s primary category.
The mix tilt toward Vapor Pens at 81.17% alongside a rank of 54 in Colorado suggests concentration risk: a 26.64% MoM slide in the dominant category exerts more pressure than the 12.37% MoM dip in Concentrates. Coupled with a 5.82% YoY price decrease and a 23.48% YoY sales decline, the pattern implies that Haze (CO)’s current positioning is price-reactive rather than demand-accretive in Vapor Pens, and that broadening the 18.83% Concentrates share or re-segmenting pen offerings could reduce sensitivity to further rank slippage and volume compression.
Competitive Landscape
Haze (CO) sits at rank #54 in Colorado Vapor Pens in September 2026, down 8 positions year over year from #46 and up 6 positions from June 2026’s #60, signaling a recovery trend off a longer slide from a peak at #16 in October 2024; against this backdrop, Spherex held #1 with a 1.9% YoY sales increase while PAX climbed from #3 to #2 on 34.7% YoY growth, indicating that Haze (CO)’s mid-pack drift occurs as leaders consolidate share through double-digit gains. The combination of an 8-rank YoY decline and a 6-rank rebound over the last three months implies Haze (CO) is stabilizing but must convert short-term momentum into sustained share capture amid competitors posting 64.0% to 150.9% YoY growth at ranks #5 and #4.

Notable Products
Juice Box - Strawberry Smash Live Resin Cartridge (2g) posted the steepest decline at -66.1% month over month and fell to rank 7, while Juice Box - Blue Gelato Live Resin Pod (2g) dropped -38.9% to rank 3, signaling a sharp reset within the larger-format live resin lineup. Juice Box - Palisade Peach Kush Live Resin Disposable (2g) also slid -19.7% at rank 1 even as Maui Wowie Distillate Cartridge (1g) rose +13.4% at rank 2, and four of the top ten are Vapor Pens SKUs concentrated in 2g live resin formats. Blueberry Diesel Live Sugar (4g) gained +22.7% to rank 8 while Italian Soda Artizinal Live Resin Cartridge (1g) edged +5.2% at rank 9, suggesting value and smaller-format alternatives are absorbing demand away from 2g live resin despite Palisade Peach Kush still leading with $15,255. The pattern implies Haze (CO) is pivoting from heavy reliance on large 2g live resin pens toward a mix where 1g distillate and Concentrates provide more stability and headroom for recovery.
Top Selling Cannabis Brands





Data for this report comes from real-time sales reporting by participating cannabis retailers via their point-of-sale systems, which are linked up with Headset’s business intelligence software. Headset’s data is very reliable, as it comes digitally direct from our partner retailers. However, the potential does exist for misreporting in the instance of duplicates, incorrectly classified products, inaccurate entry of products into point-of-sale systems, or even simple human error at the point of purchase. Thus, there is a slight margin of error to consider. Brands listed on this page are ranked in the top twenty within the market and product category by total retail sales volume.

