Jun-2026
Sales
Trend
6-Month
Product Count
SKUs
Avg Price
YoY Sales Change
YoY Price Change
Market Insights Snapshot
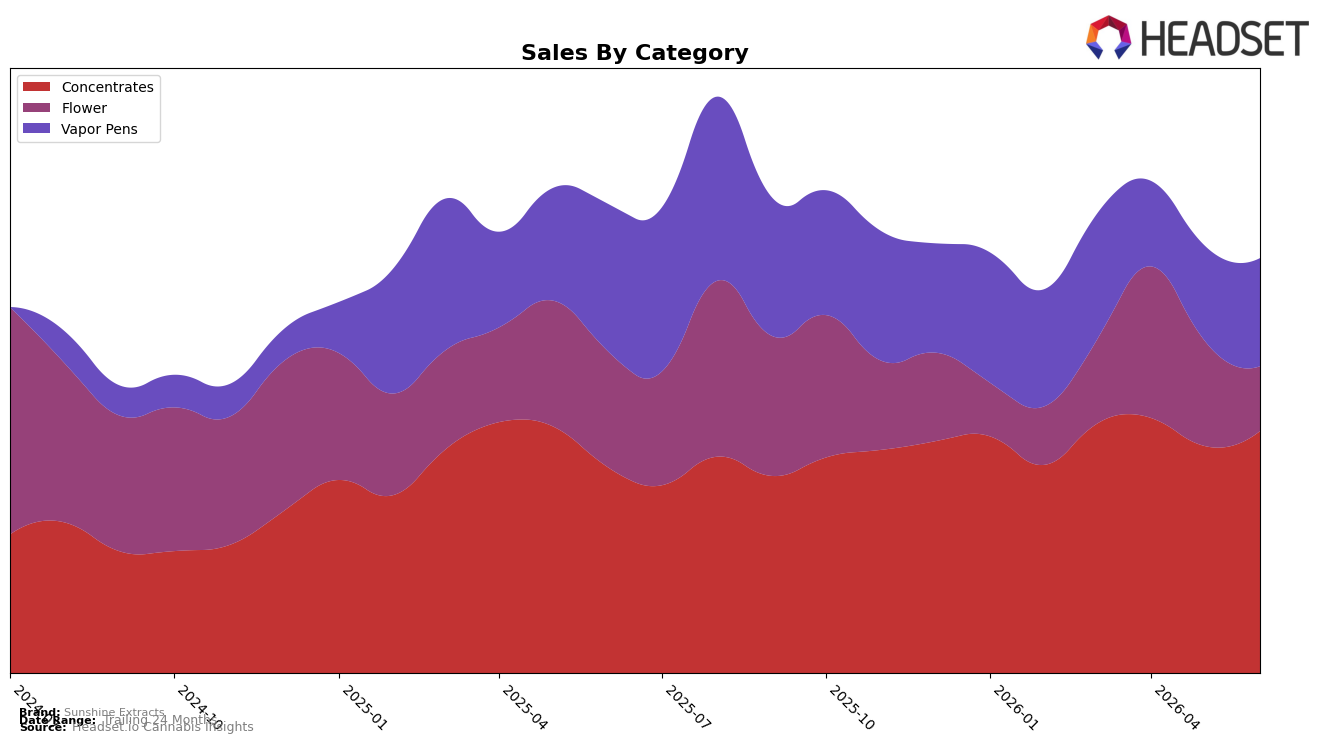
In June 2026, Concentrates held 56.66% share with 16.90% YoY growth and 6.29% MoM, while Vapor Pens accounted for 26.55% share with a -25.05% YoY change but a 12.38% MoM uptick. Flower contracted to 16.79% share with -40.64% YoY and -35.15% MoM, and the brand’s average price fell 22.90% YoY to $22.95 as Concentrates’ average price sat at 28.76. This mix signals a pivot toward higher-margin extraction formats despite the brand’s overall -10.86% YoY sales change, implying that Concentrates’ expansion is offsetting a rapid Flower pullback.
Positioning in Concentrates is reinforced by a state-category rank of #5 in Colorado and a 6.29% MoM lift, even as Vapor Pens rebound MoM by 12.38% from a -25.05% YoY base. The simultaneous -35.15% MoM and -40.64% YoY declines in Flower, alongside Concentrates’ 16.90% YoY increase, implies Sunshine Extracts is consolidating around extract-led differentiation, using Concentrates strength to buffer volatility in inhalable commodity segments.
Competitive Landscape
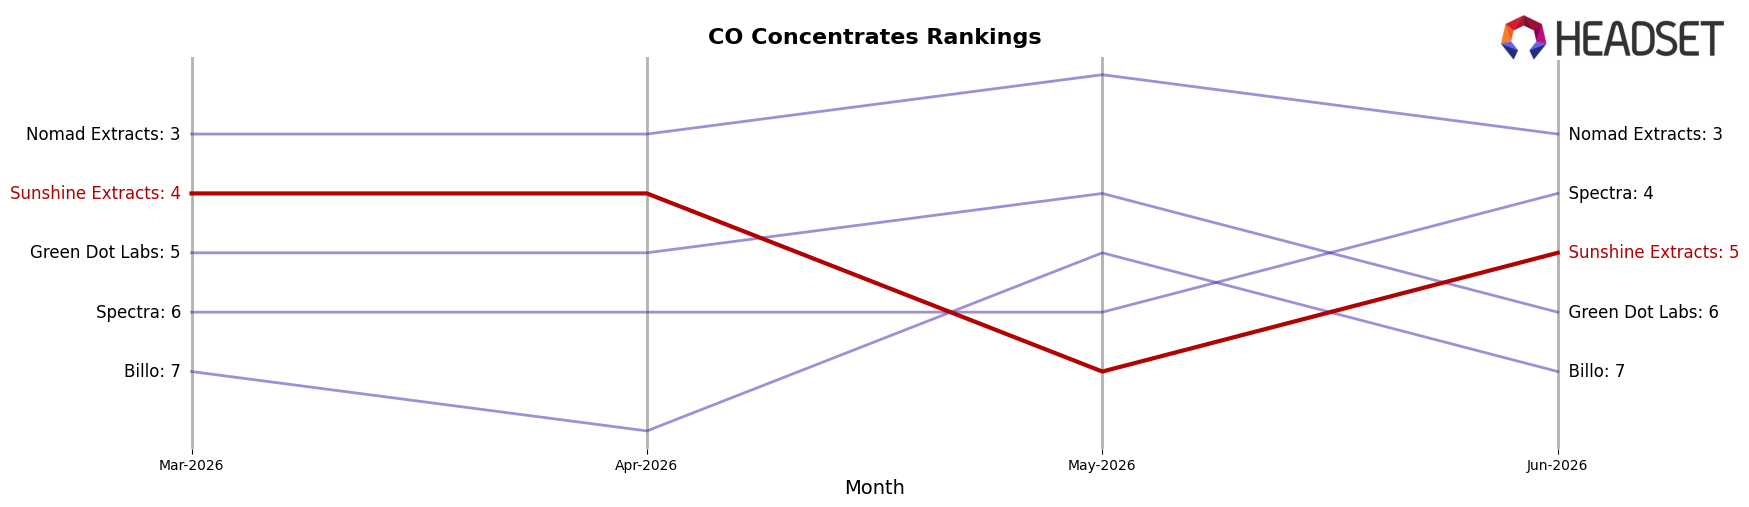
Sunshine Extracts sits at rank #5 in June 2026, improving 1 position year over year from #6 while slipping 1 spot from its April 2026 peak at #4, indicating a mild pullback after a short-term high. Competitive movement is mixed: Amber held at #1 year over year with a 39.0% sales increase, widening the gap at the top, whereas 710 Labs stayed at #2 despite a 9.9% sales decline, and Nomad Extracts climbed from #5 to #3 with an 18.1% sales lift. With Spectra steady at #4 alongside a 5.5% sales contraction, Sunshine Extracts’ year-over-year rise of one rank but quarter-to-date drop of one rank implies a crowded mid-top tier where holding share requires countering competitors’ divergent momentum near ranks #3–#5.
Notable Products
Delish (1g) posted the standout move with a +172.9% month-over-month surge to rank 1, while Cream Smoothie (1g) fell -80.7% and slid to rank 5, signaling a sharp intra-Flower rotation. Kombucha (Bulk) climbed +34.3% at rank 3 as Sweat Retreat (3.5g) dropped -28.4% alongside a -8.2% dip for Garlic Drip Live Rosin Disposable (0.5g) at rank 8, indicating gains are concentrated in select Flower formats rather than evenly spread. Four of the top ten are Flower SKUs, yet the split between rank 1 and ranks 5–7 implies a narrowing product funnel around a single winner more than a category-wide lift. The pattern implies Sunshine Extracts is consolidating around a breakout Flower hero while de-prioritizing lagging Flower sizes and tempering Vapor Pens, a mix that points toward depth in one flagship rather than breadth across formats.
Top Selling Cannabis Brands
Data for this report comes from real-time sales reporting by participating cannabis retailers via their point-of-sale systems, which are linked up with Headset’s business intelligence software. Headset’s data is very reliable, as it comes digitally direct from our partner retailers. However, the potential does exist for misreporting in the instance of duplicates, incorrectly classified products, inaccurate entry of products into point-of-sale systems, or even simple human error at the point of purchase. Thus, there is a slight margin of error to consider. Brands listed on this page are ranked in the top twenty within the market and product category by total retail sales volume.

