Market Insights Snapshot
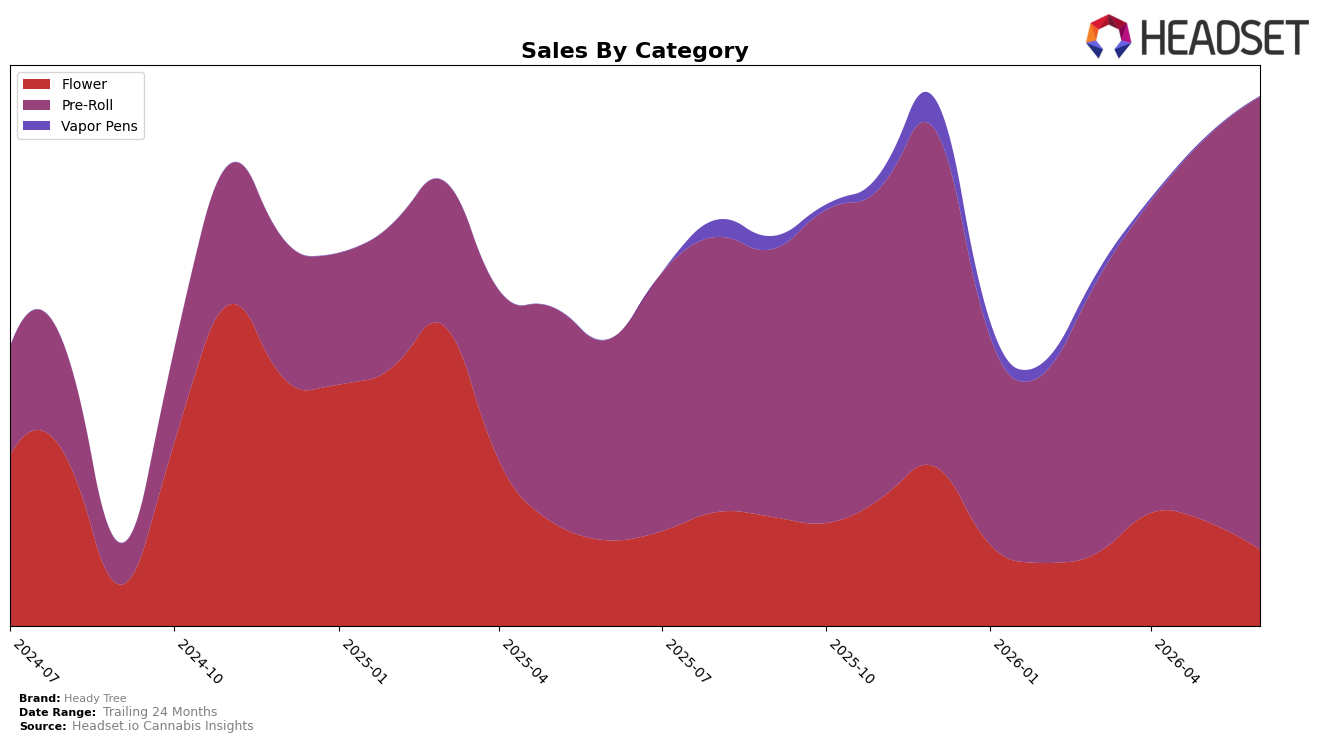
In June 2026, Heady Tree concentrated 85.47% of sales in Pre-Roll with year-over-year growth of 125.52% and month-over-month growth of 18.64%, while Flower held 14.44% share with a -10.56% YoY decline and a -27.30% MoM drop; Vapor Pens made up just 0.08% with a -59.26% MoM slide and no YoY basis. The brand’s average price fell 15.70% YoY to $16.47 even as total brand sales rose 85.01% YoY, and within Pre-Roll the average price sat lower at $14.93 versus Flower at $41.92. The pattern implies Heady Tree is pulling volume via lower-priced Pre-Rolls while exiting or deprioritizing higher-ticket Flower and ultra-niche Vapor Pens, concentrating its mix to scale units and share.
Heady Tree’s Pre-Roll rank of 4 in New York aligns with the 18.64% MoM acceleration in its largest category and the concurrent -27.30% MoM contraction in Flower, signaling a positioning choice toward velocity over basket value. With Pre-Roll at 85.47% mix and Flower at 14.44%, the 125.52% YoY surge in the dominant line alongside a 15.70% brand-wide price deflation indicates a trade-down capture strategy rather than premium expansion. This implies near-term defensibility in high-frequency segments but rising dependence on one category, where sustaining a top-5 rank will likely require continued price discipline and SKU breadth to avoid margin erosion as mix skews further to low-ASP units.
Competitive Landscape
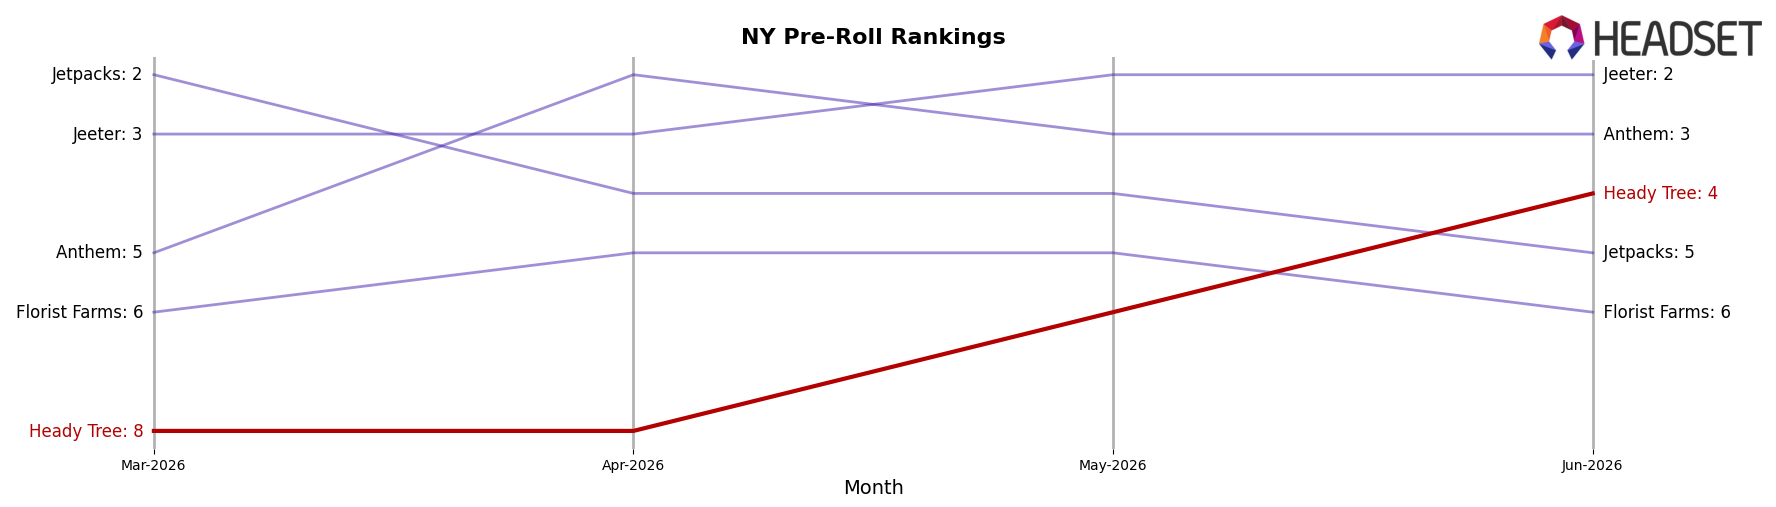
Heady Tree is ranked #4 in NY Pre-Roll in June 2026, rising 4 positions year over year from #8, and climbing 4 spots since March 2026 when it was also #8; by contrast, Ruby Farms held #1 with a 15.6% year-over-year sales increase while Anthem moved from #40 to #3 alongside an 852.1% sales surge. Meanwhile, Jetpacks slipped from #3 to #5 with an 8.6% decline in year-over-year sales, and Jeeter sits at #2 with no reported year-over-year figure; the combination of Heady Tree’s advance to a peak rank of #4 in June 2026 and competitors shifting both up and down implies the brand’s trajectory is upward but dependent on sustaining share gains against faster movers directly above and below it.
Notable Products
Lemon Cherry Sherbet Pre-Roll (1g) posted the steepest movement in June 2026 with a -13.6% month-over-month drop while sliding to rank 8, whereas Candy Fumez Pre-Roll (1g) rose 32.8% to solidify rank 2; the spread between -13.6% and +32.8% inside the top 10 indicates volatile demand shaping mix decisions. Da Yayo Pre-Roll (1g) held rank 1 with +19.4% growth while Cap Junkie Pre-Roll (1g) climbed 24.7% at rank 4, and nine of the top ten are Pre-Roll SKUs, concentrating the portfolio in a single format. Blue Zushi Pre-Roll (1g) in rank 5 inched up 1.9% as Blue Lobster Kief Infused Pre-Roll (1g) hovered near flat at -0.6%, and the top two SKUs together generated about $243,000, pointing to a strategy that leans into a few fast-moving Pre-Rolls while pruning underperforming variants.
Top Selling Cannabis Brands
Data for this report comes from real-time sales reporting by participating cannabis retailers via their point-of-sale systems, which are linked up with Headset’s business intelligence software. Headset’s data is very reliable, as it comes digitally direct from our partner retailers. However, the potential does exist for misreporting in the instance of duplicates, incorrectly classified products, inaccurate entry of products into point-of-sale systems, or even simple human error at the point of purchase. Thus, there is a slight margin of error to consider. Brands listed on this page are ranked in the top twenty within the market and product category by total retail sales volume.

