Dec-2025
Sales
Trend
6-Month
Product Count
SKUs
Avg Price
YoY Sales Change
YoY Price Change
Market Insights Snapshot
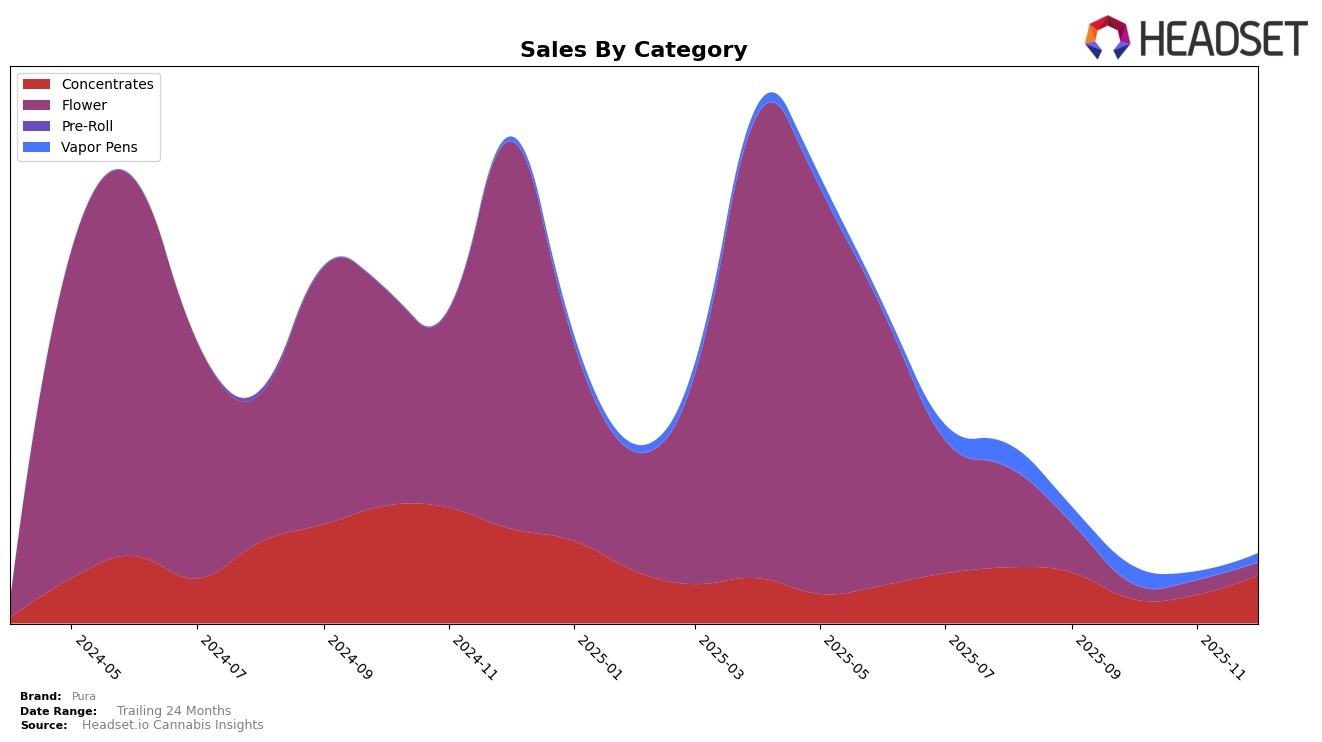
In the state of New York, Pura has shown a fluctuating performance in the Concentrates category over the last few months of 2025. Starting the period in September at rank 19, the brand experienced a notable drop to rank 28 in October. However, Pura managed to recover slightly, climbing back to rank 24 in November and further improving to rank 20 by December. This movement indicates a resilience in their market presence, despite facing challenges in maintaining a top-tier position. The sales figures reflect this trend, with a significant dip in October but a recovery in the following months, suggesting strategic adjustments or market conditions that favored their resurgence.
The absence of Pura from the top 30 in other states or categories during this period could be seen as a missed opportunity for the brand to expand its footprint beyond New York. This highlights a potential area for growth, as diversifying their market presence could buffer against the volatility observed in their current primary market. The data suggests that while Pura has managed to regain some of its lost ground in New York, there remains a significant opportunity for the brand to explore other markets and categories to stabilize and potentially enhance its overall market position.
Competitive Landscape
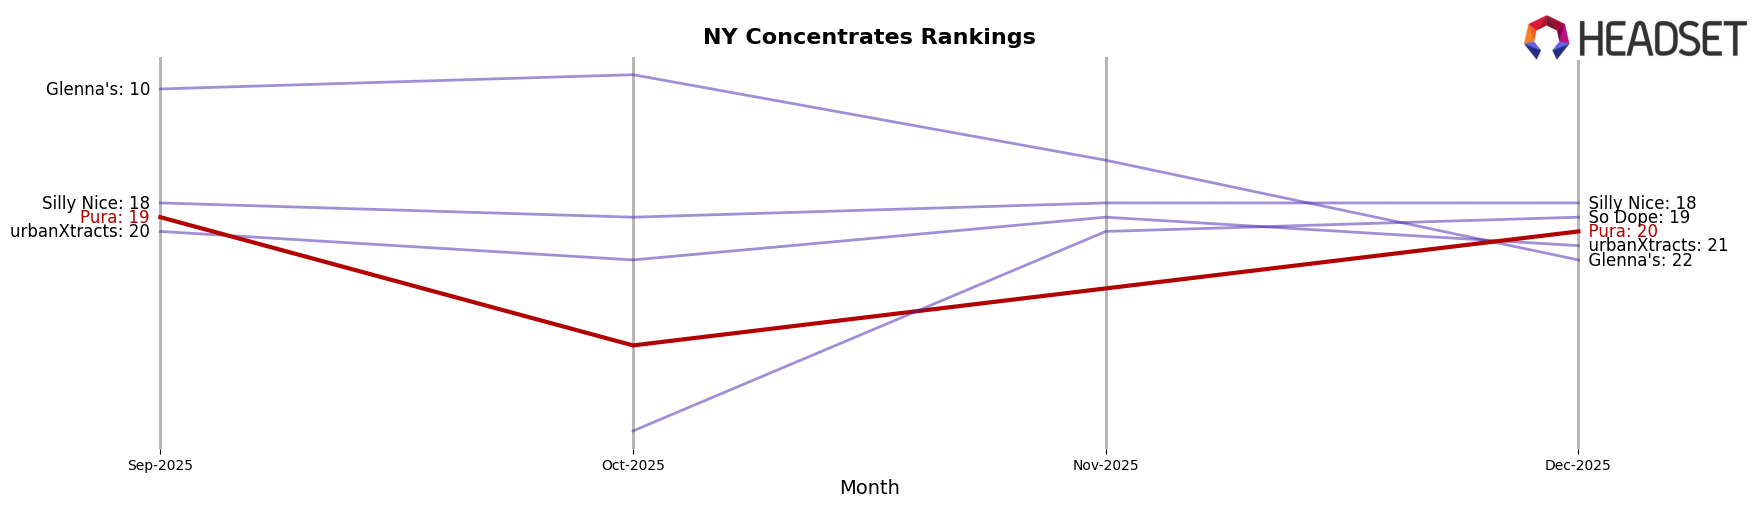
In the competitive landscape of the New York concentrates market, Pura has experienced notable fluctuations in its ranking over the last few months of 2025. Pura's rank dropped significantly from 19th in September to 28th in October, but it managed to recover to 20th by December. This volatility contrasts with the more stable performance of brands like Silly Nice, which maintained a consistent position around 18th. Meanwhile, urbanXtracts and So Dope showed resilience, with So Dope climbing from outside the top 20 in September to 19th by December. Glenna's saw a sharp decline from 9th in October to 22nd in December, indicating potential challenges. Pura's sales mirrored its ranking volatility, with a significant dip in October followed by a recovery in December, suggesting that while the brand faces stiff competition, it has the potential to rebound and capture market share.
Notable Products
In December 2025, the top-performing product for Pura was Durban Poison x Cherry Tart Sugar (2g) in the Concentrates category, maintaining its rank from November with notable sales of 202 units. Red Velvet x Lemon Cherry Gelato Cured Resin Sugar (2g) held the second position, showing a consistent performance compared to previous months. Durban Poison x Cherry Tart Cured Sugar (2g) ranked third, improving from its debut in November. GMO Gelato (3.5g) appeared in the rankings for the first time, securing the fourth position in the Flower category. Terp Poison Live Resin (1g) maintained its fifth-place ranking from November, indicating stable sales performance.
Top Selling Cannabis Brands
Data for this report comes from real-time sales reporting by participating cannabis retailers via their point-of-sale systems, which are linked up with Headset’s business intelligence software. Headset’s data is very reliable, as it comes digitally direct from our partner retailers. However, the potential does exist for misreporting in the instance of duplicates, incorrectly classified products, inaccurate entry of products into point-of-sale systems, or even simple human error at the point of purchase. Thus, there is a slight margin of error to consider. Brands listed on this page are ranked in the top twenty within the market and product category by total retail sales volume.

