.svg)

Sep-2026
Sales
Trend
6-Month
Product Count
SKUs
Avg Price
YoY Sales Change
YoY Price Change


Where to Buy
To The Moon is stocked at 161 licensed dispensaries across New York, with the deepest coverage in New York, Brooklyn, Queens, The Bronx, and Staten Island. Search by ZIP code or city below to find the closest one, or filter by product type if you are after a specific format.
Market Insights Snapshot
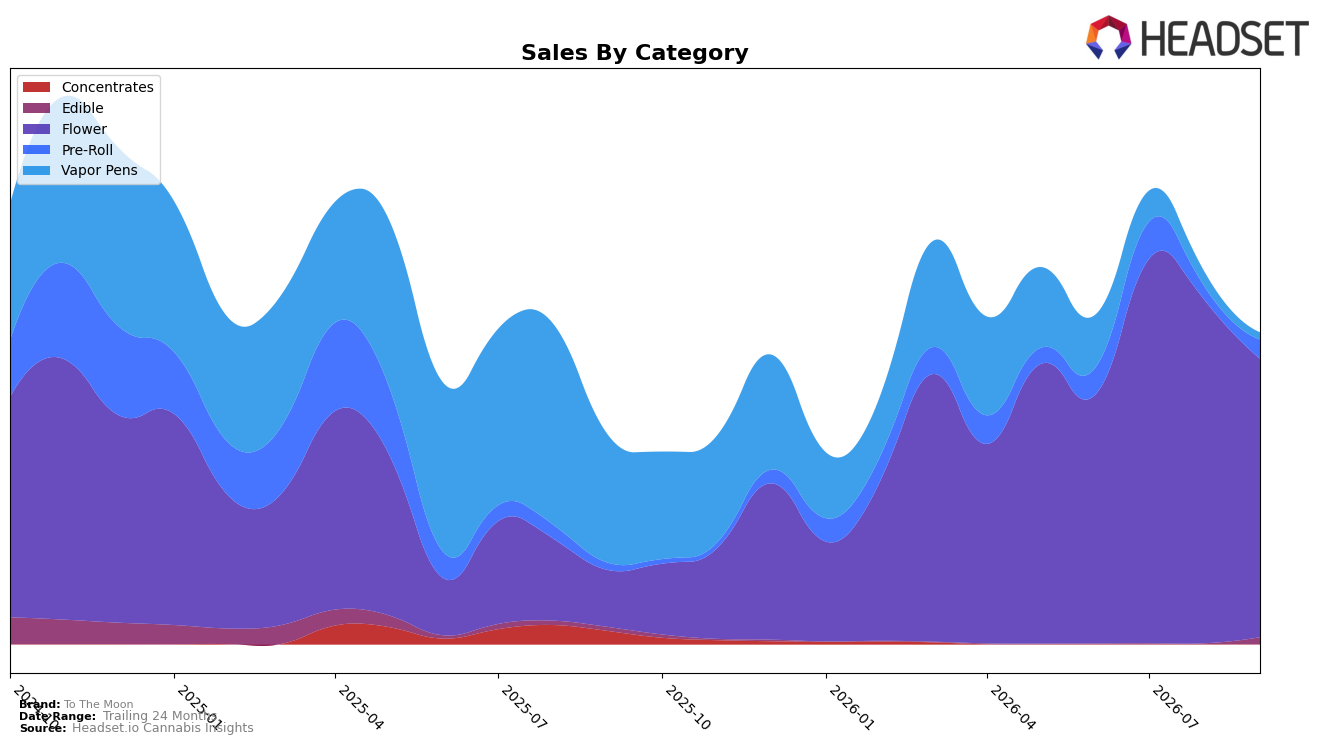
In September 2026, To The Moon concentrated 89.58% of sales in Flower, up 392.04% year over year but down 18.84% month over month, while Pre-Roll held 6.04% share with 173.63% YoY growth and 43.53% MoM gain. Vapor Pens contracted to 2.23% share with a -94.57% YoY and -51.92% MoM slide, as Edible rose to 2.16% share on 83.52% YoY growth and a 925.39% MoM spike. With an average price at $42.04 and up 12.79% YoY, and a Flower average price of $47.82, the mix signals a pivot toward higher-priced Flower even as month-over-month softness in Flower is offset by tactical Pre-Roll and Edible rebounds; the pattern implies the brand is trading into premiumized inhalables while pruning or losing traction in Vapor Pens.
Within New York Flower, To The Moon sits at rank 19, a position consistent with a share-heavy Flower strategy (89.58%) but vulnerable to the -18.84% MoM Flower decline and the -94.57% YoY collapse in Vapor Pens. The combination of a 49.58% brand-level YoY sales lift and a 29.32% two-year decline suggests reliance on recent Flower momentum rather than diversified durability; the implication is that maintaining rank 19 will require stabilizing Flower’s MoM volatility and converting Edible’s 925.39% MoM surge and Pre-Roll’s 43.53% MoM growth into sustained share so the portfolio isn’t overexposed to a single category’s swings.
Competitive Landscape
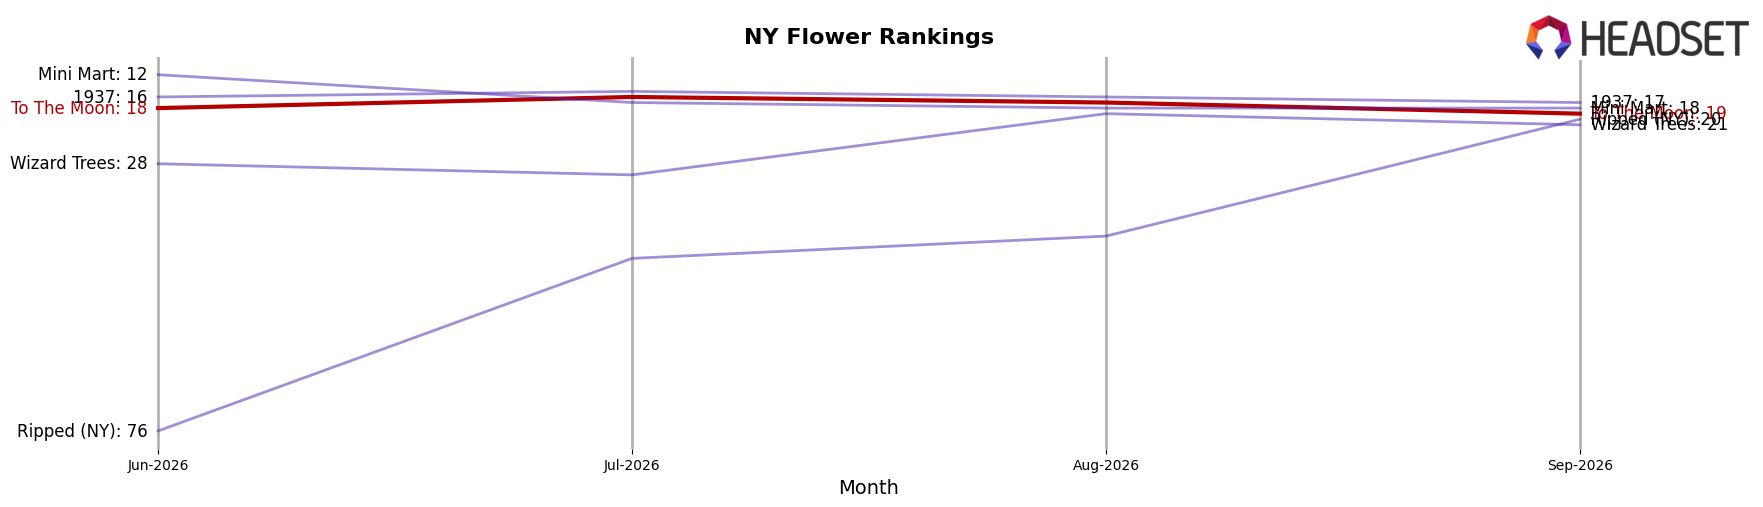
To The Moon is ranked #19 in NY Flower in September 2026, a 50-rank climb from #69 year over year, while slipping 1 position from #18 in June 2026; the brand’s trajectory sits below its historical peak of #12 in September 2024 and trails the current top tier where Find. moved up from #5 to #1 with 16.2% YoY sales growth and Grassroots advanced from #15 to #2 with 150.3% YoY growth, indicating that despite sizable rank recovery, closing the gap to leaders requires sustaining gains faster than category climbers now occupying the top five.
Notable Products
Blue Mochi (3.5g) posted the steepest month-over-month drop at -47.6% while sliding to rank 3, and Purple Headband (3.5g) fell -60.0% into rank 9, signaling a sharp retrenchment in mid-tier Flower even as Caramel Cookies (3.5g) rose +26.4% to rank 2. With Space Taxi Pre-Roll 2-Pack (1.5g) holding rank 1 and two additional Pre-Roll SKUs inside the top 10, three of the top ten are Pre-Roll products, indicating mix is tilting toward ready-to-smoke formats despite weakness in select eighths. The concentration of Flower at ranks 2, 3, 5, 6, 7, and 9 against softer MoM percent changes implies To The Moon is relying on a few resilient Flower winners while shifting demand toward Pre-Rolls to stabilize velocity.
Top Selling Cannabis Brands






Data for this report comes from real-time sales reporting by participating cannabis retailers via their point-of-sale systems, which are linked up with Headset’s business intelligence software. Headset’s data is very reliable, as it comes digitally direct from our partner retailers. However, the potential does exist for misreporting in the instance of duplicates, incorrectly classified products, inaccurate entry of products into point-of-sale systems, or even simple human error at the point of purchase. Thus, there is a slight margin of error to consider. Brands listed on this page are ranked in the top twenty within the market and product category by total retail sales volume.

