Market Insights Snapshot
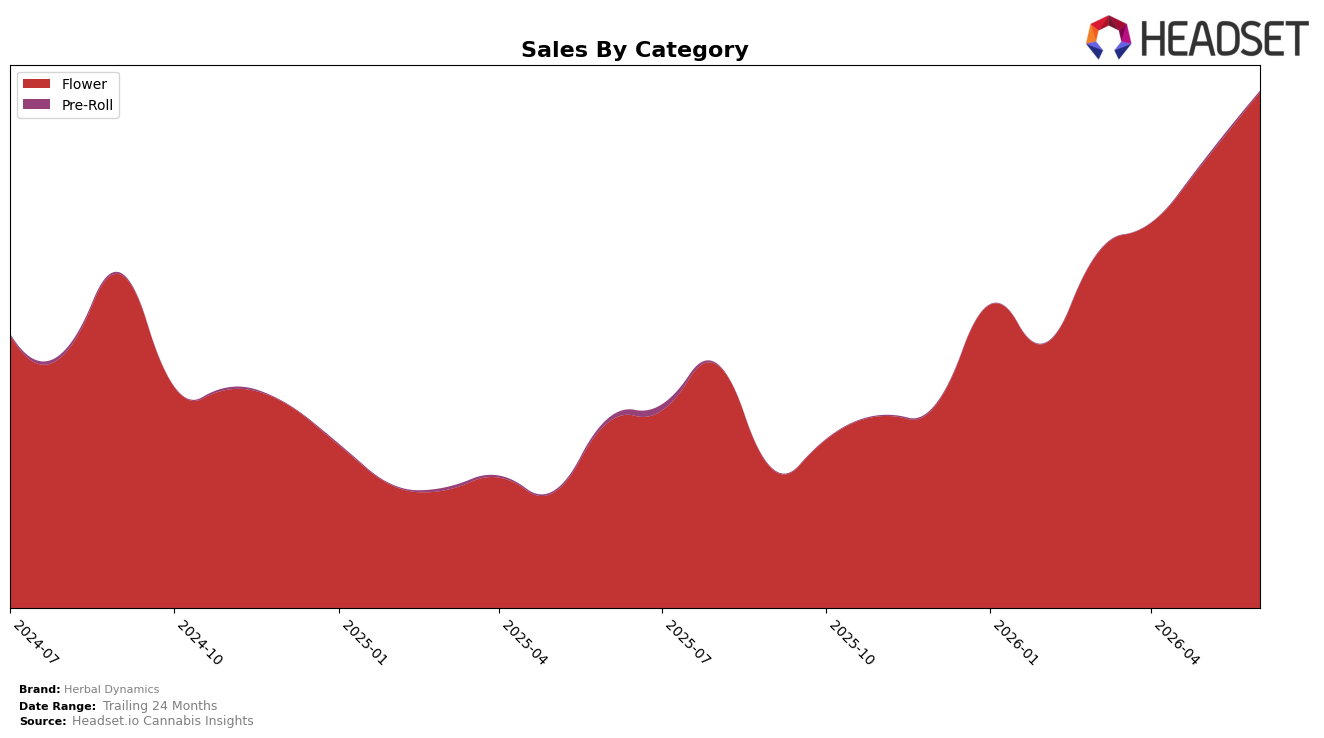
Herbal Dynamics concentrated 99.74% share in Flower during June 2026, with Flower up 178.34% year over year and 15.48% month over month, while Pre-Roll fell 63.52% YoY and 29.67% MoM to just 0.26% share. Average price rose 15.09% YoY to $34.35, with Flower averaging 35.05 and Pre-Roll at 4.02, indicating mix-driven pricing lift. In Oregon Flower, Herbal Dynamics held rank 11, signaling category concentration supported by double-digit MoM momentum but constrained diversification as Pre-Roll contraction offsets breadth.
The shift toward a 99.74% Flower mix and a 15.48% MoM uptick indicates Herbal Dynamics is leaning into a single-category scale play to climb from rank 11 in Oregon; the -29.67% MoM in Pre-Roll suggests the brand is ceding entry-price trial formats in favor of higher-ticket Flower that lifted average price 15.09% YoY. With Flower’s 178.34% YoY surge but Pre-Roll at just 0.26% share, the path forward implies reinforcing Flower assortment and price laddering while the thinning Pre-Roll presence limits cross-category capture and may cap rank gains if category volatility shifts.
Competitive Landscape
Herbal Dynamics sits at #11 in Oregon Flower in June 2026 after a 31-place jump from #42 year over year, and it improved 7 positions from #18 three months ago while briefly peaking at #9 in May 2026; by contrast, PRUF Cultivar / PRŪF Cultivar held #1 with an 18.7% YoY sales increase and Grown Rogue climbed from #6 to #2 on 124.0% YoY growth, indicating that Herbal Dynamics’ ascent is occurring alongside faster top-tier gains. With Bald Peak steady at #3 despite a 5.6% YoY decline and Urban Canna rising from #12 to #5 on 43.9% YoY growth, Herbal Dynamics’ movement from #42 to #11 and near-term slip from #9 to #11 implies momentum is building but the window to secure a sustained top-10 position is narrowing as competitors accelerate.

Notable Products
Lemon Terpsicle (Bulk) posted the standout move in June 2026 with a 210.7% month-over-month surge into rank 2, while Pineapple Bang (Bulk) fell 87.3% to rank 9; this divergence signals volatile demand concentration within Flower. Velvet Glove (Bulk) also advanced 62.5% month-over-month to hold rank 1, as Golden Sunset (Bulk) declined 24.1% at rank 6, and five of the top ten are Flower SKUs, indicating category-heavy exposure. Frosted Flakez (Bulk) added 85.7% month-over-month at rank 5 alongside a single Pre-Roll entry at rank 10 with $501 in sales, pointing to limited cross-format traction versus accelerating bulk Flower velocity. The mix implies Herbal Dynamics is leaning into bulk Flower winners while tolerating sharp SKU-level swings, prioritizing scale over format diversification.
Top Selling Cannabis Brands
Data for this report comes from real-time sales reporting by participating cannabis retailers via their point-of-sale systems, which are linked up with Headset’s business intelligence software. Headset’s data is very reliable, as it comes digitally direct from our partner retailers. However, the potential does exist for misreporting in the instance of duplicates, incorrectly classified products, inaccurate entry of products into point-of-sale systems, or even simple human error at the point of purchase. Thus, there is a slight margin of error to consider. Brands listed on this page are ranked in the top twenty within the market and product category by total retail sales volume.

