May-2026
Sales
Trend
6-Month
Product Count
SKUs
Avg Price
YoY Sales Change
YoY Price Change
Market Insights Snapshot
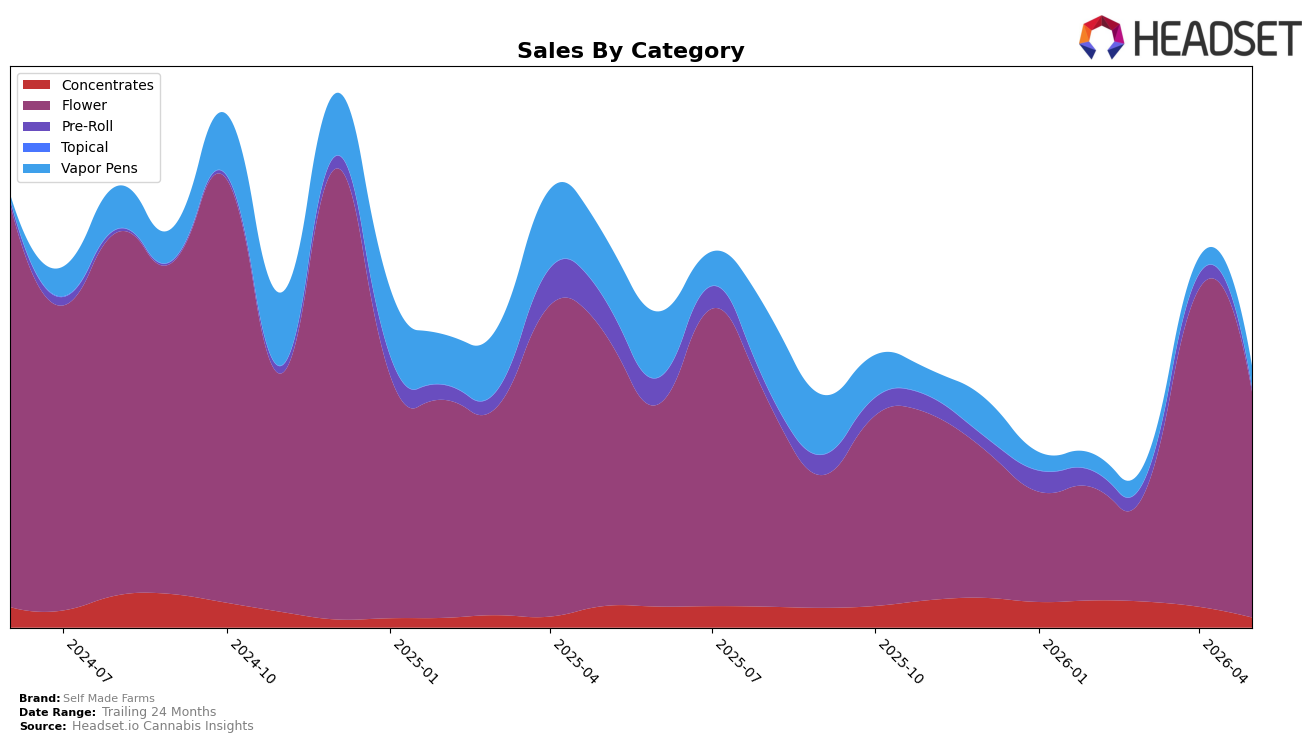
Self Made Farms concentrated 86.68% of May 2026 sales in Flower, where sales fell 17.81% year over year and 28.89% month over month, while Vapor Pens held 8.16% share with a 66.14% YoY decline but a 31.23% MoM uptick. Concentrates at 3.76% share dropped 53.79% YoY and 52.30% MoM, and Pre-Roll at 1.40% share contracted 89.24% YoY and 74.57% MoM; the brand’s overall sales declined 33.64% YoY even as the average price rose 191.12% YoY. With Flower ranked 23rd in Oregon, the mix implies overexposure to a contracting core and limited insulation from smaller, faster-swinging segments.
The combination of a 28.89% MoM pullback in the 86.68% Flower base and a 31.23% MoM rise in the 8.16% Vapor Pens slice indicates short-term demand is tilting toward lower-ticket or convenience formats while the flagship category softens, a pattern reinforced by a 52.30% MoM slide in Concentrates and a 74.57% MoM slide in Pre-Roll. Given a 191.12% YoY average price lift alongside a 33.64% YoY sales decline, the price-to-volume tradeoff appears unfavorable in the highest-weighted category, suggesting the brand’s positioning skews premium on paper but functions as a volume-constrained niche within Flower and a volatility absorber in smaller formats.
Competitive Landscape
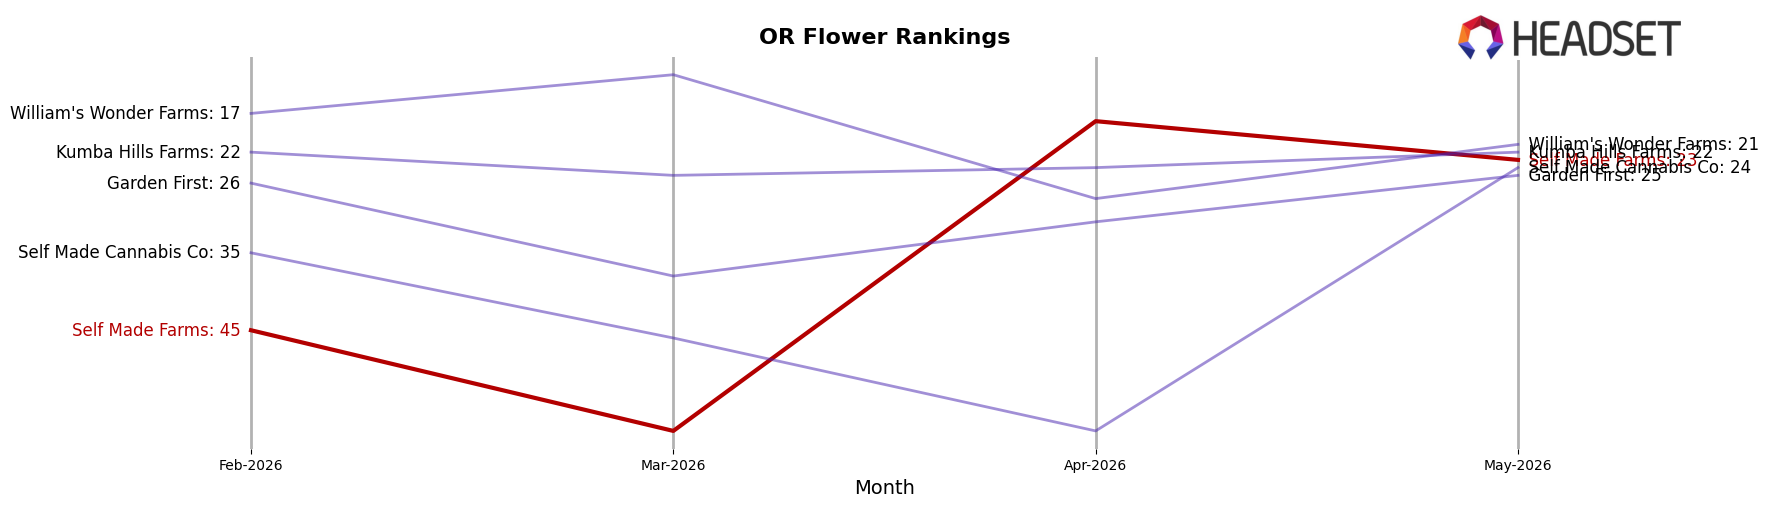
Self Made Farms sits at rank #23 in OR Flower in May 2026, down 1 position year over year from #22 and up 22 spots since February 2026 when it was #45; both contrast with its prior peak of #6 in December 2024 and a top-5 field where PRUF Cultivar / PRŪF Cultivar held #1 both this year and last while Grown Rogue climbed from #7 to #2. With Otis Garden jumping from #20 to #5 alongside a 101.4% sales YoY change while Self Made Farms slipped 1 rank YoY and recovered 22 ranks quarter-to-date, the pattern implies mid-pack stabilization driven by recent momentum but capped by a widened gap to leaders.
Notable Products
Chem Bros Pre-Roll (1g) led the movement with a -65.8% month-over-month drop to rank 1, while Pink Lemonade (28g) surged +68.5% into rank 3, creating a split signal between the top spot and the fastest riser. Sour Jack (28g) also climbed with a +65.6% gain at rank 4, contrasted by Ultra Sour (28g) falling -49.7% at rank 8, and Colombian Gold (28g) declining -35.2% at rank 5. Four of the top ten are Flower SKUs at ounce size, concentrating share in bulk formats even as a pre-roll leader contracts sharply. The pattern implies Self Made Farms is tilting toward higher-volume Flower packs as growth engines while smaller-format volatility at the top spot pressures mix stability in May 2026.
Top Selling Cannabis Brands
Data for this report comes from real-time sales reporting by participating cannabis retailers via their point-of-sale systems, which are linked up with Headset’s business intelligence software. Headset’s data is very reliable, as it comes digitally direct from our partner retailers. However, the potential does exist for misreporting in the instance of duplicates, incorrectly classified products, inaccurate entry of products into point-of-sale systems, or even simple human error at the point of purchase. Thus, there is a slight margin of error to consider. Brands listed on this page are ranked in the top twenty within the market and product category by total retail sales volume.

