.svg)

Sep-2026
Sales
Trend
6-Month
Product Count
SKUs
Avg Price
YoY Sales Change
YoY Price Change


Where to Buy
Heylo is stocked at 63 licensed dispensaries across Washington, with the deepest coverage in Seattle, Everett, Tacoma, Bellingham, and Spokane. Search by ZIP code or city below to find the closest one, or filter by product type if you are after a specific format.
Market Insights Snapshot
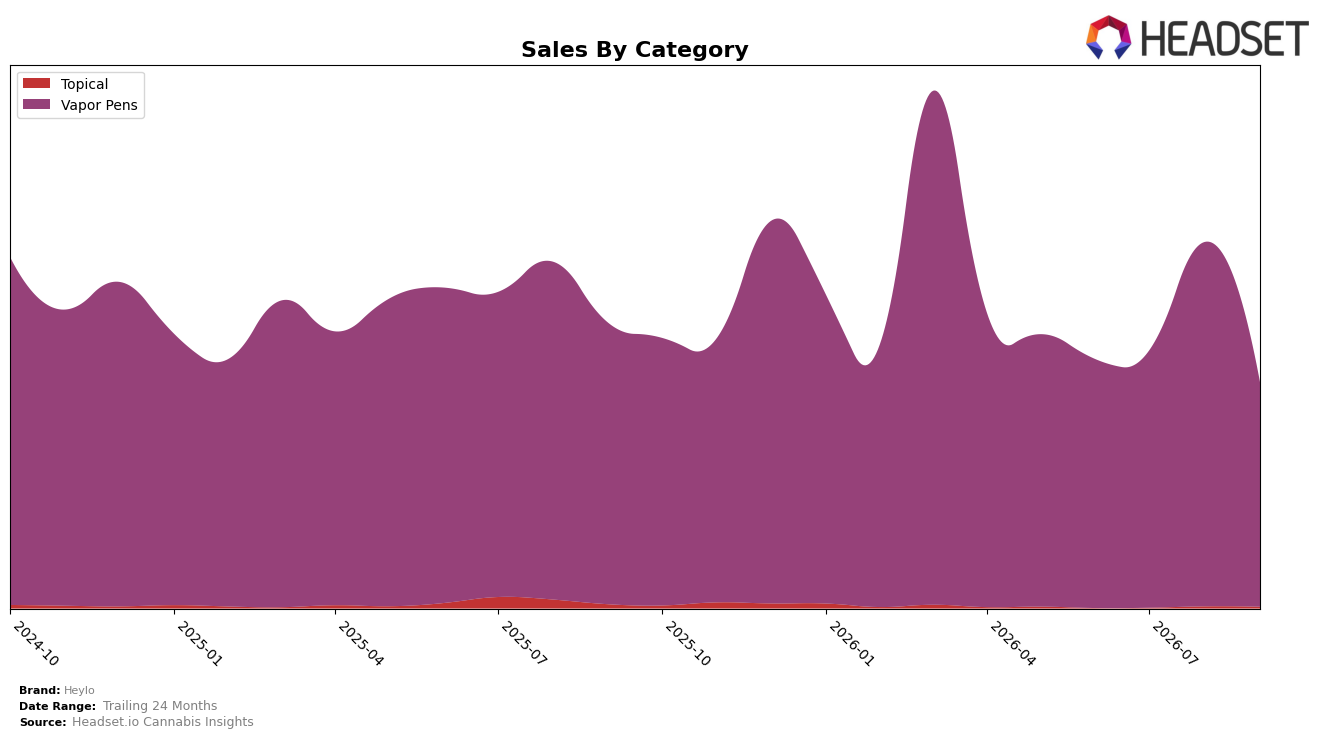
Heylo’s September 2026 mix is overwhelmingly concentrated in Vapor Pens at 98.22% share, with Topical contributing 1.78%, indicating a narrow category footprint as Vapor Pens declined 19.99% year over year and 38.09% month over month while Topical fell 38.08% year over year and 9.21% month over month. With brand-level sales down 20.41% year over year and average price down 3.12%, the sharper month-over-month drop in Vapor Pens versus a milder month-over-month decline in Topical implies overexposure to a single category amplifying volatility rather than price-led pressure; the pattern points to a concentration risk where slight Topical stabilization cannot offset Vapor Pens contraction.
At rank 81 in Vapor Pens in Washington, the combination of a 38.09% month-over-month decline in Vapor Pens and only a 9.21% month-over-month decline in Topical suggests the brand’s positioning is tethered to a weakening primary category, limiting upward mobility in the current rank band. Given a 98.22% Vapor Pens share and a 19.99% year-over-year decline in that category versus a 38.08% year-over-year decline in Topical, the relative scale still dictates performance, implying that modest category diversification or sub-segment reallocation within Vapor Pens would reduce month-to-month swings and support more durable placement in the state-category ranking.
Competitive Landscape
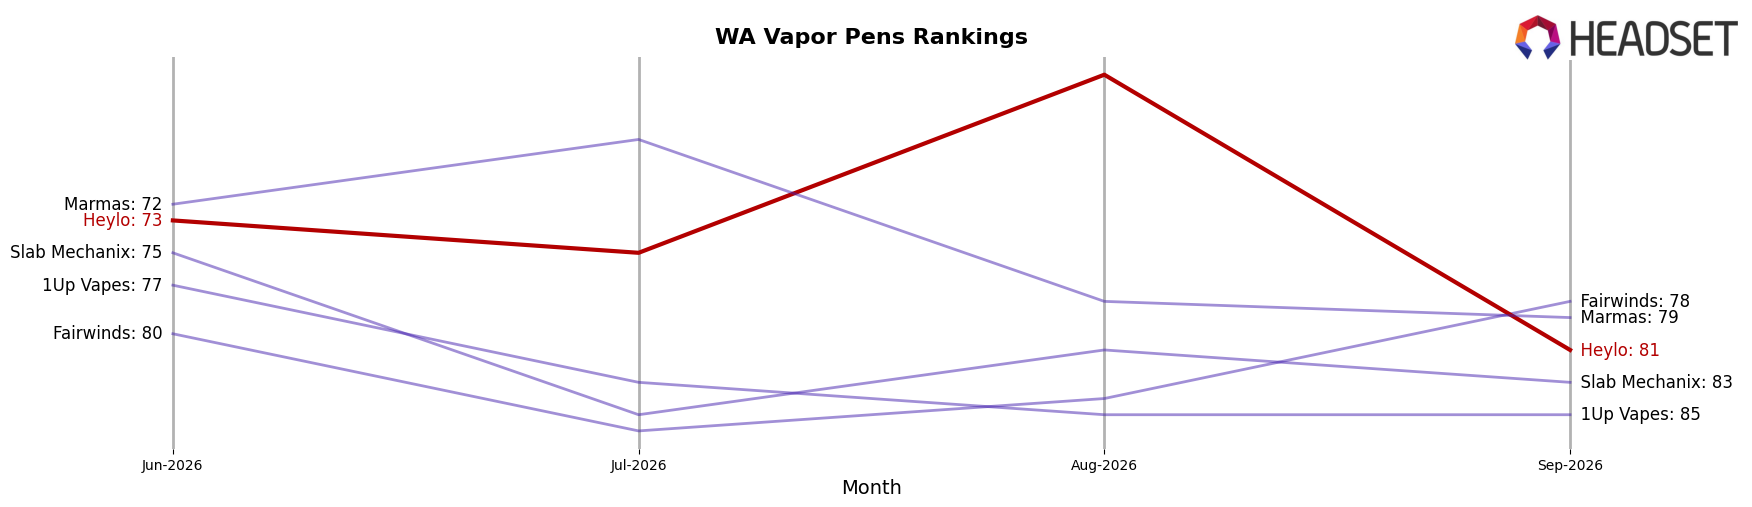
Heylo sits at rank #81 in WA Vapor Pens in September 2026, a 16-place decline from #65 year over year and an 8-position drop from #73 in June 2026, while remaining far from its peak of #44 reached in March 2026; in contrast, Crystal Clear climbed from #3 to #1 with a 26.4% YoY sales increase and Mfused slid from #1 to #2 alongside a 30.9% YoY sales decline, indicating that Heylo’s downward rank shift coincides with consolidation at the top where upward mobility requires either share capture from declining leaders or differentiated growth against rising players.
Notable Products
Pineapple Fruz Distillate Cartridge (1g) posted the steepest decline at -59.7% month over month in September 2026, sliding to rank 7, while Raw X - Happy Hour CO2 Disposable (1g) fell -58.8% to a shared rank 8, signaling a retrenchment in value-oriented or promo-driven SKUs. In contrast, Pineapple Crush Hash Rosin Disposable (1g) jumped 74.0% MoM to rank 1 with $6,019, as Bicycle Kush CO2 Cartridge (1g) dropped -35.0% to rank 3, flipping category leadership within Vapor Pens where all top ten placements belong to this single segment. The split between rising hash rosin disposables and declining CO2/distillate cartridges—one SKU up 74.0% at rank 1 versus two SKUs down more than -58% at ranks 7–8—implies Heylo is pivoting toward higher-spec formulations and away from legacy CO2 SKUs as the core of its assortment.
Top Selling Cannabis Brands






Data for this report comes from real-time sales reporting by participating cannabis retailers via their point-of-sale systems, which are linked up with Headset’s business intelligence software. Headset’s data is very reliable, as it comes digitally direct from our partner retailers. However, the potential does exist for misreporting in the instance of duplicates, incorrectly classified products, inaccurate entry of products into point-of-sale systems, or even simple human error at the point of purchase. Thus, there is a slight margin of error to consider. Brands listed on this page are ranked in the top twenty within the market and product category by total retail sales volume.

