Jun-2026
Sales
Trend
6-Month
Product Count
SKUs
Avg Price
YoY Sales Change
YoY Price Change
Market Insights Snapshot
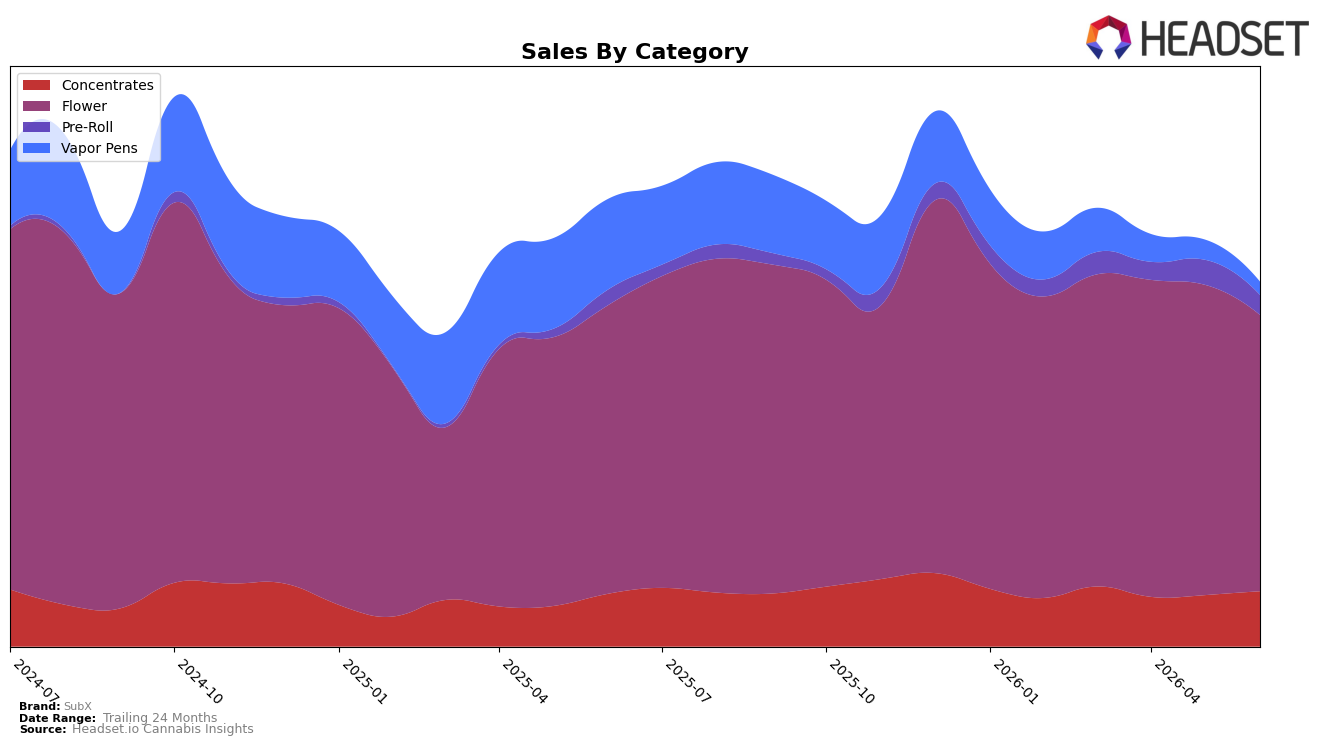
SubX’s category mix in June 2026 is anchored by Flower at 70.26% share with a month-over-month decline of 10.62% and a year-over-year decline of 4.13%, while Concentrates hold 16.23% share with a 6.26% MoM increase and a 3.91% YoY increase. Pre-Roll accounts for 7.58% share with a 13.83% MoM drop but a 16.55% YoY gain, and Vapor Pens sit at 5.94% share with a 22.17% MoM decline and a 76.11% YoY decline. With brand-level sales down 16.84% YoY and average price down 10.49% YoY to $16.70, the mix indicates SubX is pivoting away from Vapor Pens toward value-leaning Flower and Concentrates, which implies near-term volume protection at the expense of higher-ticket penetration.
These shifts place SubX’s positioning closer to value-forward inhalables, with Flower’s June 2026 category rank at 23 in Washington aligning with the 10.62% MoM Flower contraction and the 22.17% MoM slide in Vapor Pens. The 6.26% MoM growth in Concentrates alongside a 13.83% MoM pullback in Pre-Roll implies promotional or assortment reallocation toward categories that can absorb the 10.49% YoY price decrease while stabilizing share, suggesting the path to regain rank will rely on Concentrates momentum and curbing volatility in Pre-Roll rather than chasing the 76.11% YoY decline in Vapor Pens.
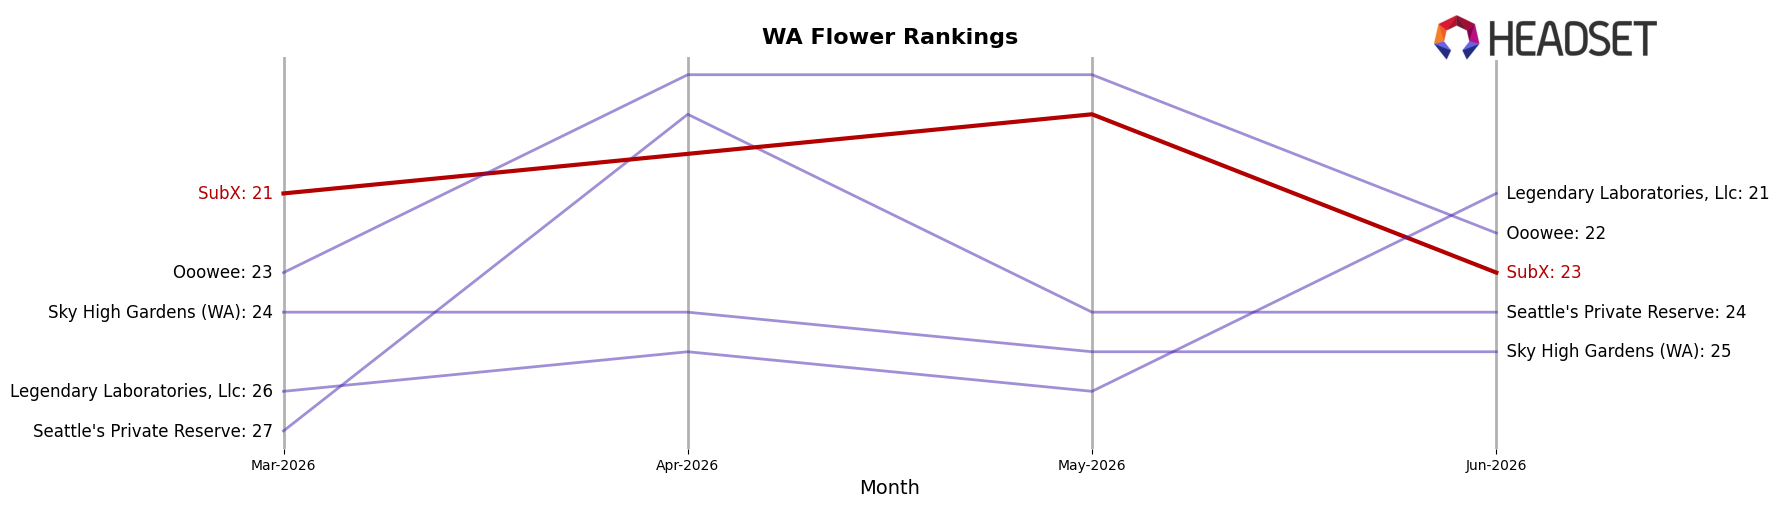
Competitive Landscape
SubX is currently ranked #23 in WA Flower in June 2026, unchanged year over year from #23, while slipping 2 positions from #21 in March 2026 and sitting 8 places below its peak of #15 in August 2024; in contrast, Lifted Cannabis Co climbed from #8 to #3 and Fifty Fold moved from #9 to #4 as Legends held #2 despite a -19.8% YoY sales change. With Phat Panda steady at #1 alongside a +16.6% YoY sales increase and Sweetwater Farms surging from #17 to #5 on +65.8% YoY sales, SubX’s flat YoY rank at #23 and 2-position slide since March 2026 indicate a loss of relative momentum against peers that are consolidating share through upward rank mobility.
Notable Products
GMO (1g) posted the largest move in June 2026 with +56.1% MoM to rank 4, while Orange Poison Pre-Roll 2-Pack (1g) fell -34.5% MoM at rank 8, indicating demand is tilting toward small-size Flower and away from value Pre-Rolls. GMO (3.5g) held rank 1 with +12.5% MoM as Cap Junky (3.5g) slipped -8.0% at rank 2, and four of the top ten are Flower SKUs concentrated in eighth-ounce formats that are holding or improving rank. With one SKU surging over +50% and the only double-digit decline sitting in Pre-Rolls, the mix implies SubX is consolidating around Flower-led share and de-emphasizing lower-margin Pre-Rolls.
Top Selling Cannabis Brands
Data for this report comes from real-time sales reporting by participating cannabis retailers via their point-of-sale systems, which are linked up with Headset’s business intelligence software. Headset’s data is very reliable, as it comes digitally direct from our partner retailers. However, the potential does exist for misreporting in the instance of duplicates, incorrectly classified products, inaccurate entry of products into point-of-sale systems, or even simple human error at the point of purchase. Thus, there is a slight margin of error to consider. Brands listed on this page are ranked in the top twenty within the market and product category by total retail sales volume.

