.svg)

Sep-2026
Sales
Trend
6-Month
Product Count
SKUs
Avg Price
YoY Sales Change
YoY Price Change


Where to Buy
Hi-Klas is stocked at 25 licensed dispensaries across Arizona, with the deepest coverage in Phoenix, Tucson, Glendale, Chandler, and Apache Junction. Search by ZIP code or city below to find the closest one, or filter by product type if you are after a specific format.
Market Insights Snapshot
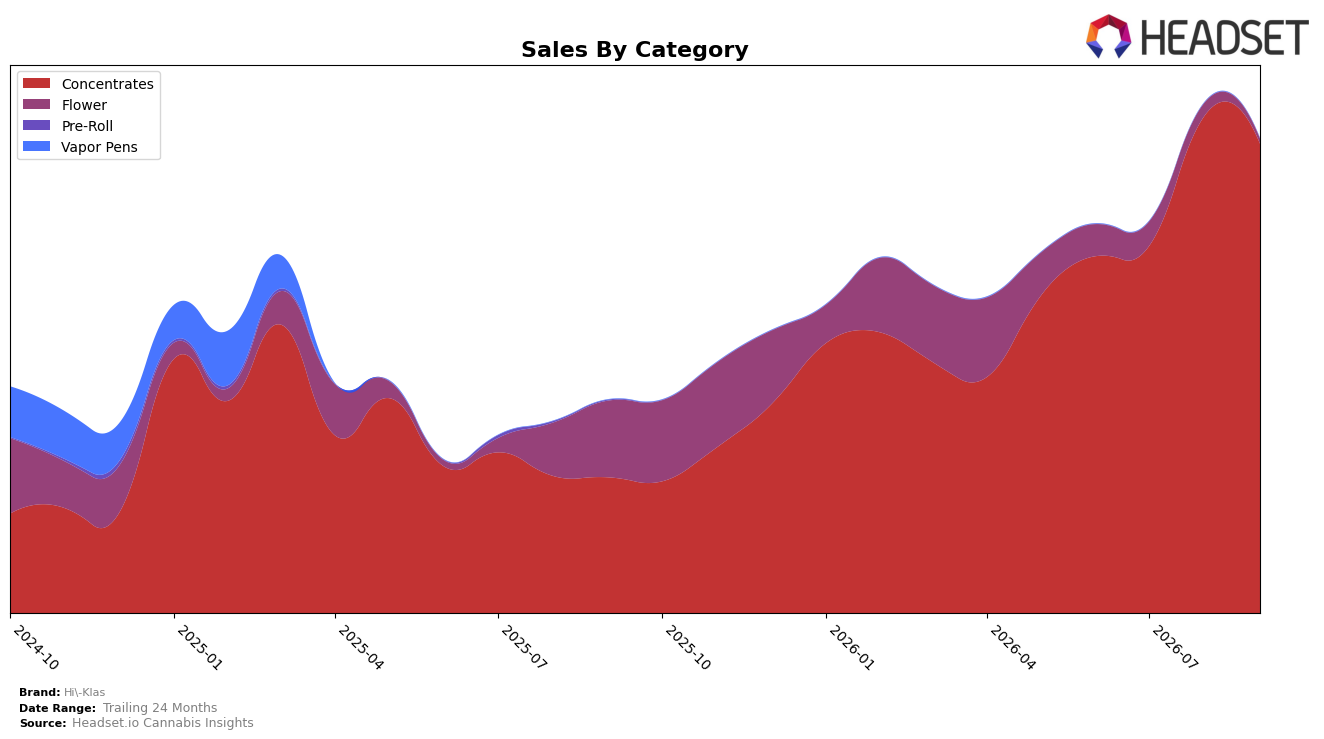
In September 2026, Hi-Klas concentrated its revenue in Concentrates at 99.03% share while Flower fell to 0.97% share, pairing a 246.64% year-over-year surge in Concentrates with a 93.99% year-over-year decline in Flower. Month over month, Concentrates contracted 5.65% as Flower dropped 63.86%, and the average price across the brand decreased 28.36% year over year to one of the lowest points of the year. The pattern implies a deliberate pivot toward Concentrates volume at lower price points, with Flower now a residual SKU set rather than a growth engine.
Hi-Klas’s mix leaves its positioning tightly aligned to Concentrates, where a rank of 6 in Arizona indicates meaningful scale but also exposure to category-specific swings; the 5.65% month-over-month dip in Concentrates, combined with a 63.86% monthly decline in Flower, suggests vulnerability if Concentrates cool further. Given brand sales growth of 123.27% year over year alongside a 28.36% price decrease, the brand is leaning on unit throughput to climb share and sustain rank, which implies continued emphasis on depth within the top category rather than broadening into Flower near term.
Competitive Landscape
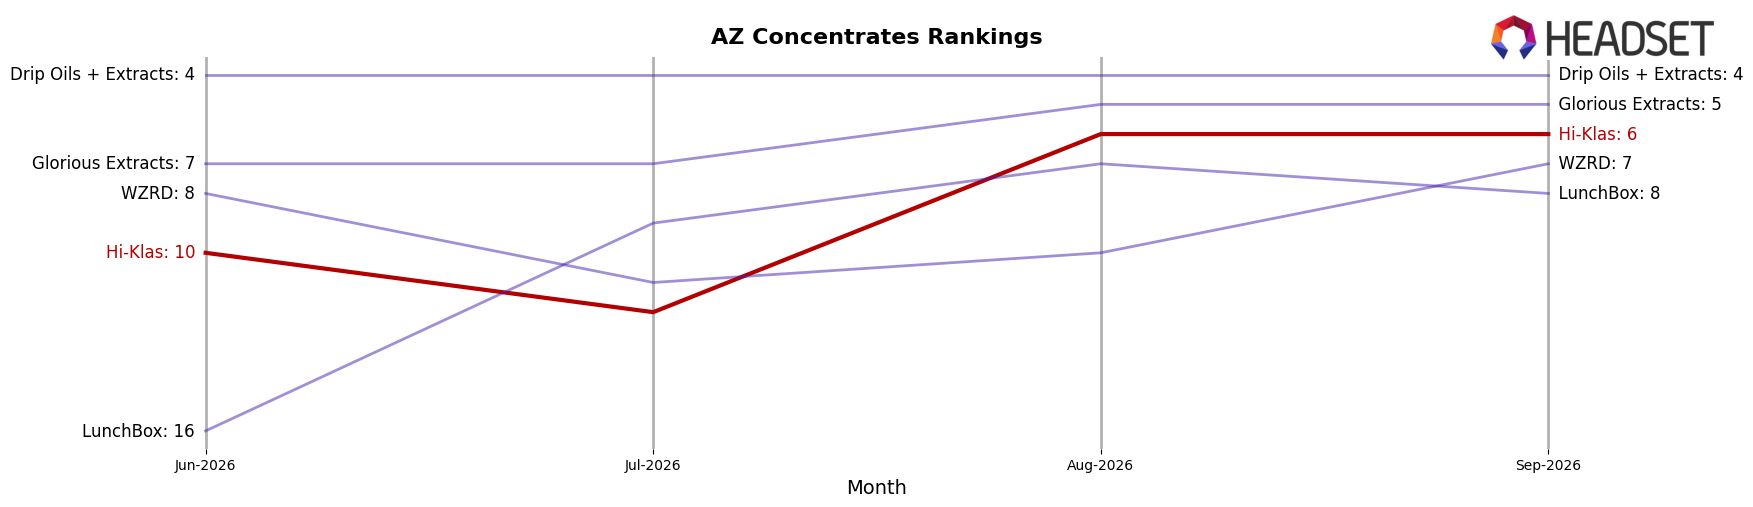
Hi-Klas ranks #6 in AZ Concentrates in September 2026, a YoY climb of 18 positions from #24, and an improvement of 4 spots from #10 in June 2026, reaching its peak rank of #6 in September 2026. In the same period, Mohave Cannabis Co. held steady at #1 YoY while growing sales by 16.8%, and Glorious Extracts advanced from #29 to #5 with a 495.5% sales increase, indicating that Hi-Klas’s ascent into the top 6 is occurring amid rapid reshuffling at the top. The directional comparison suggests Hi-Klas is gaining rank faster than stable leaders but slower than surging risers, implying its trajectory positions it as a contender for a top‑5 entry if momentum from September 2026 persists.
Notable Products
The Chauffeur Budder (1g) posted the largest movement with a 190.2% month-over-month surge, jumping to rank 1, while Holy Grail OG Shatter (1g) fell 24.4% to rank 2. Gaschata Live Resin Budder (1g) slipped 2.0% yet also shows at rank 1 due to category-level tie handling, and Ice Cream Cake Live Budder (1g) rose 40.3% at rank 4. Four of the top ten are Live SKUs within Concentrates, and Papaya Bomb Live Sugar (1g) dropped 53.5% at rank 9, implying a portfolio tilt toward higher-velocity live budder formats and away from lagging live sugar variants.
Top Selling Cannabis Brands






Data for this report comes from real-time sales reporting by participating cannabis retailers via their point-of-sale systems, which are linked up with Headset’s business intelligence software. Headset’s data is very reliable, as it comes digitally direct from our partner retailers. However, the potential does exist for misreporting in the instance of duplicates, incorrectly classified products, inaccurate entry of products into point-of-sale systems, or even simple human error at the point of purchase. Thus, there is a slight margin of error to consider. Brands listed on this page are ranked in the top twenty within the market and product category by total retail sales volume.

