.svg)

Aug-2026
Sales
Trend
6-Month
Product Count
SKUs
Avg Price
YoY Sales Change
YoY Price Change


Where to Buy
Kan+Ade is stocked at 95 licensed dispensaries across California, with the deepest coverage in Los Angeles, San Francisco, Santa Rosa, Long Beach, and Costa Mesa. Search by ZIP code or city below to find the closest one, or filter by product type if you are after a specific format.
Market Insights Snapshot
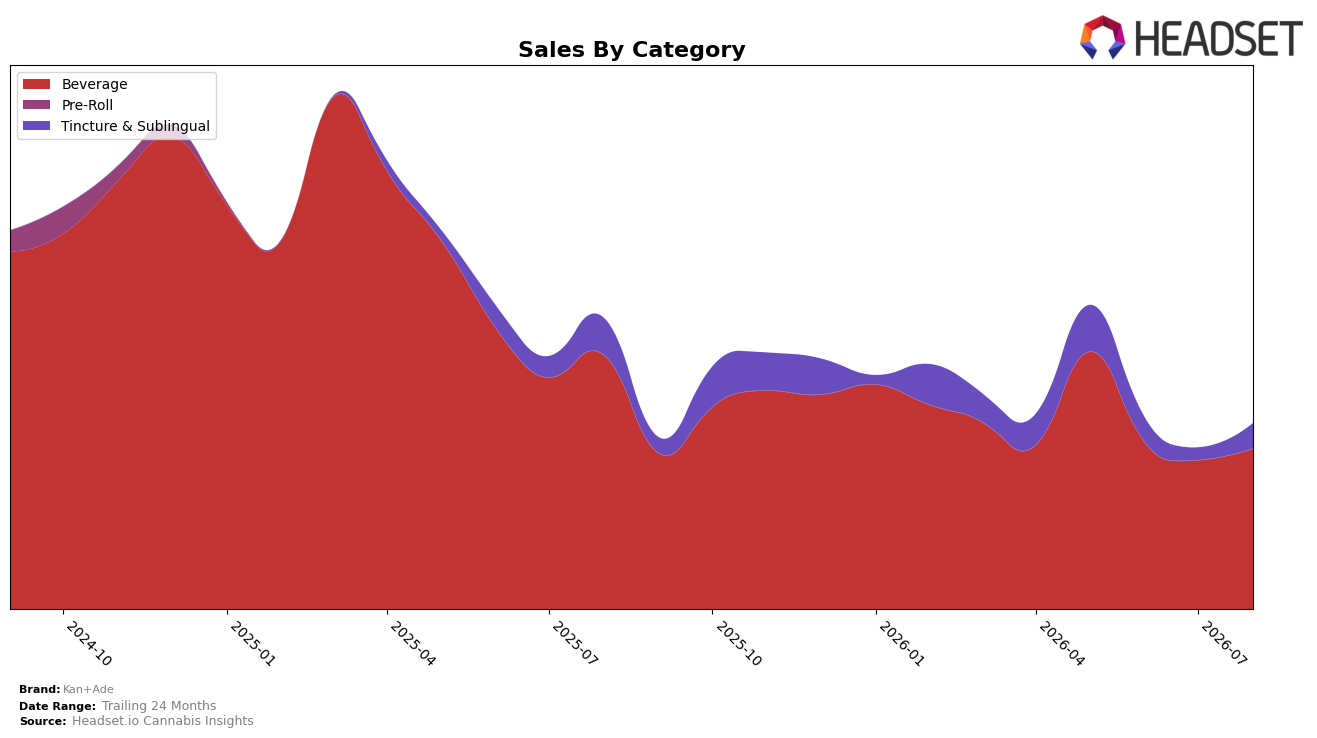
Kan+Ade’s category mix in August 2026 concentrated 86.49% of sales in Beverage, where year-over-year sales fell 36.88% while month-over-month sales rose 7.83%; Tincture & Sublingual held 13.51% share with a 31.86% year-over-year decline but a 104.79% month-over-month surge. The brand’s average price increased 5.43% year-over-year to $24.37, with Beverage priced higher at an average of $25.21 and Tincture & Sublingual at $20.07, and Beverage rank in California Beverage sat at position 14. Taken together, the mix tilt toward Beverage alongside a spike in Tincture & Sublingual suggests a near-term volume rebound is being led by lower-base SKUs in Tincture & Sublingual while Beverage provides scale but not growth, implying the brand is relying on price and mix to stabilize share rather than broad-based demand recovery.
The simultaneous 7.83% month-over-month lift in Beverage and a 104.79% month-over-month jump in Tincture & Sublingual, alongside a 36.25% brand-level year-over-year sales decline and a 54.51% two-year drop, points to a tactical pivot: incremental gains are coming from expanding the smaller Tincture & Sublingual segment without displacing Beverage’s 86.49% anchor share. With California Beverage rank at 14 and Tincture & Sublingual averaging 20.07 versus Beverage at 25.21, the widening price gap and mix shift imply a positioning that leans into accessible entry points to re-acquire buyers while maintaining premium-priced Beverage presence, indicating that growth headroom is likely constrained by Beverage rank pressure unless the Tincture & Sublingual momentum converts into sustained share above 15%.
Competitive Landscape
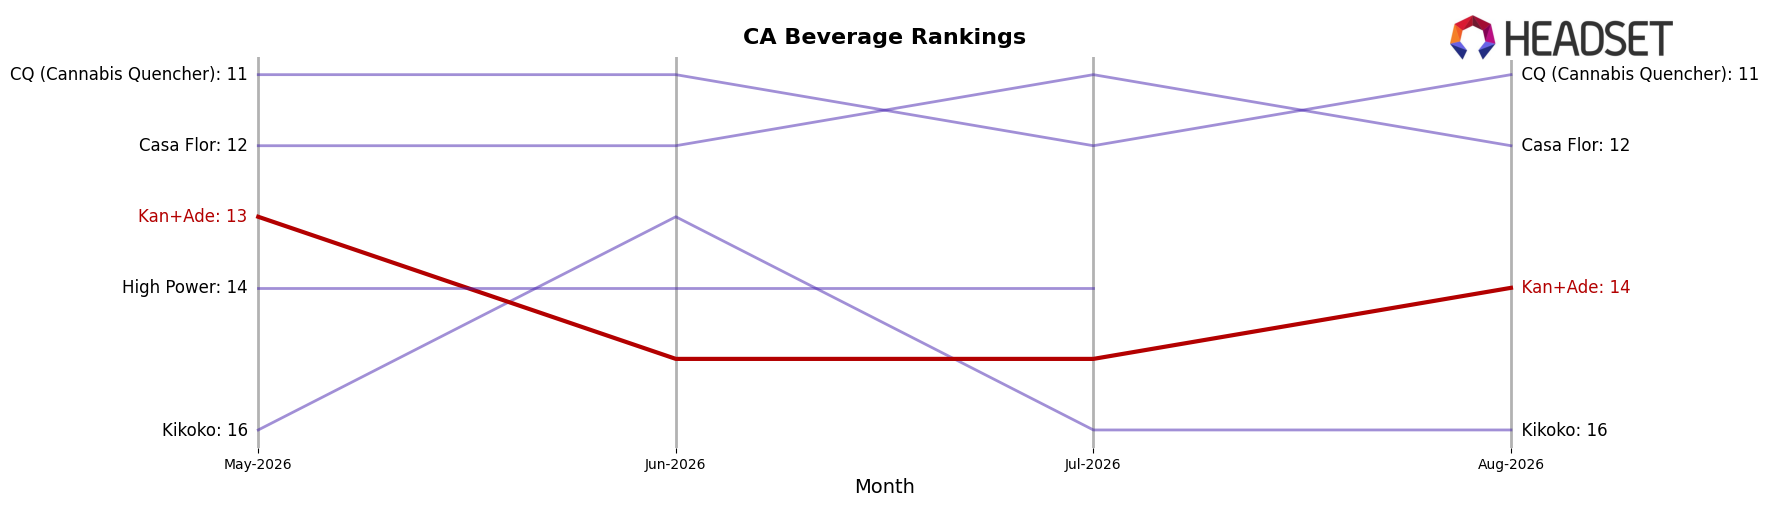
Kan+Ade sits at #14 in CA Beverage for August 2026, a +3 place climb from #17 year over year but down 1 spot from #13 in May 2026, indicating a mild retreat from its peak while still improving YoY. Competitive momentum is concentrated at the top: St Ides held #1 both this year and last (up 11.9% YoY sales), while CANN Social Tonics advanced from #9 to #5 with 286.0% YoY sales growth, outpacing Kan+Ade’s rank movement and widening the gap to the top 5. With Kan+Ade slipping from #13 to #14 over the last three months and leaders either holding or accelerating, the rank trajectory implies Kan+Ade must convert its year-over-year gain into sustained month-to-month improvements to avoid settling into the mid-teens.
Notable Products
Naked Flavorless Medible Mixer (500mg) posted the largest move in August 2026 with +1110.5% month over month and entered the top ten at rank 8, while Grape Medible Mixer (1000mg) climbed to rank 3 on +64.7% month over month. In contrast, Blueberry Pomegranate Medible Mixer Syrup (1000mg) slid -40.6% month over month to rank 2 even as Juicy Watermelon Medible Mixer (1000mg THC, 150ml) held rank 1 with a -20.9% month over month decline. Eight of the top ten SKUs are Beverage, and three Beverage SKUs posted gains above +50% while two fell more than -20%, which implies Kan+Ade is pivoting shelf space toward fast-rising mixers while pruning underperforming flavors to concentrate velocity in fewer, higher-momentum variants.
Top Selling Cannabis Brands






Data for this report comes from real-time sales reporting by participating cannabis retailers via their point-of-sale systems, which are linked up with Headset’s business intelligence software. Headset’s data is very reliable, as it comes digitally direct from our partner retailers. However, the potential does exist for misreporting in the instance of duplicates, incorrectly classified products, inaccurate entry of products into point-of-sale systems, or even simple human error at the point of purchase. Thus, there is a slight margin of error to consider. Brands listed on this page are ranked in the top twenty within the market and product category by total retail sales volume.

