.svg)

Sep-2026
Sales
Trend
6-Month
Product Count
SKUs
Avg Price
YoY Sales Change
YoY Price Change


Where to Buy
High Supply / Supply is stocked at 656 licensed dispensaries across Massachusetts, Illinois, and 7 other states, 179 of them in Massachusetts, with the deepest coverage in Boston, Brockton, Fall River, Holyoke, and Northampton. Search by ZIP code or city below to find the closest one, or filter by product type if you are after a specific format.
Market Insights Snapshot
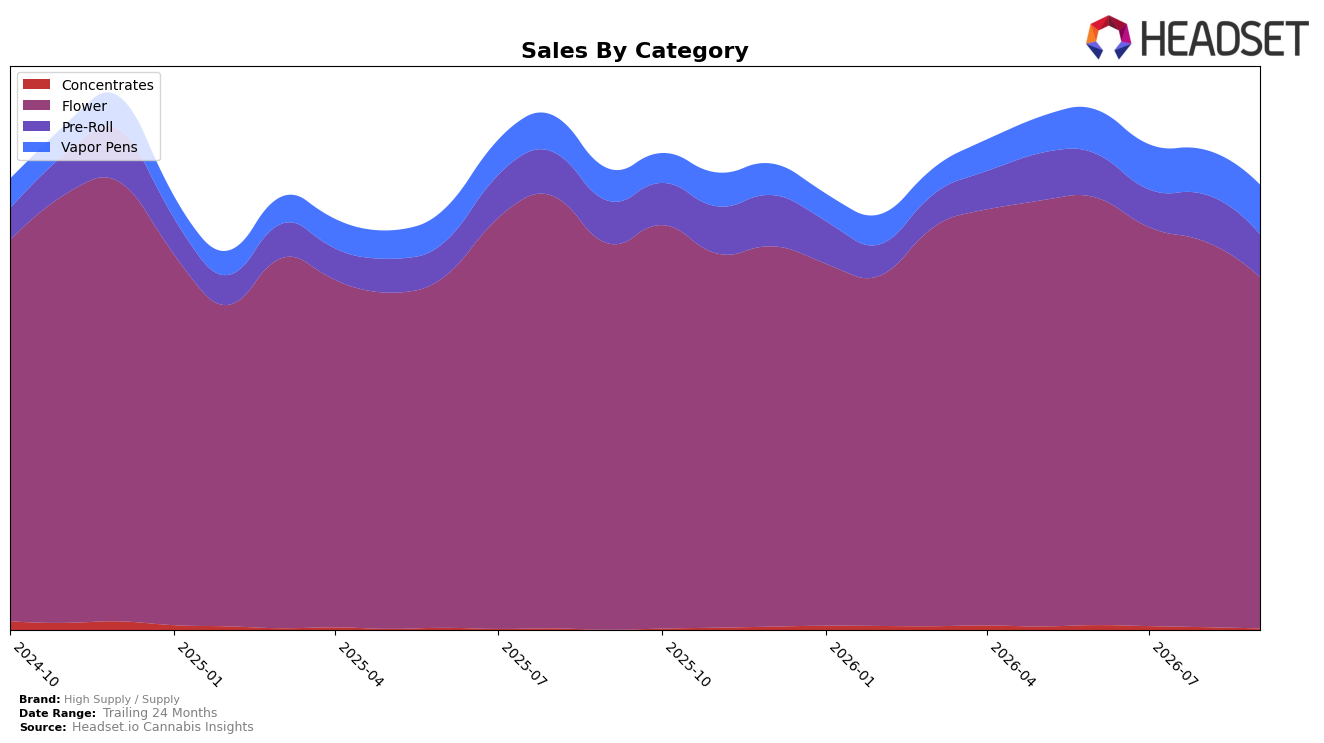
High Supply / Supply’s category mix in September 2026 was concentrated in Flower at 76.83% share, with Flower sales down 8.97% year over year and 8.83% month over month, while Vapor Pens climbed to 11.64% share with sales up 47.14% year over year and 10.13% month over month. Pre-Roll held 10.22% share with a modest 0.77% year-over-year gain but an 8.01% month-over-month decline, and Concentrates remained 1.30% share with a 28.31% year-over-year rise offset by a 17.57% month-over-month drop. With average price down 8.36% year over year and total brand sales down 3.36% year over year despite a 24-month decline of 10.61%, the pattern implies a deliberate pivot away from reliance on Flower volatility toward faster-growing, smaller formats that can cushion dips in the core.
Positioning-wise, holding rank 1 in Flower in Illinois while Flower contracted 8.97% year over year and 8.83% month over month indicates pricing and mix pressure in the core that risks overexposure at 76.83% share, whereas Vapor Pens’ 47.14% year-over-year and 10.13% month-over-month growth signal headroom to rebalance. The contrasting trajectories—Pre-Roll near flat year over year at 0.77% but down 8.01% month over month, and Concentrates up 28.31% year over year but down 17.57% month over month—imply that near-term stability will come from scaling Vapor Pens while tightening Flower assortment and promotional depth to protect average price, using Flower leadership in Illinois as leverage rather than a single-point dependency.
Competitive Landscape
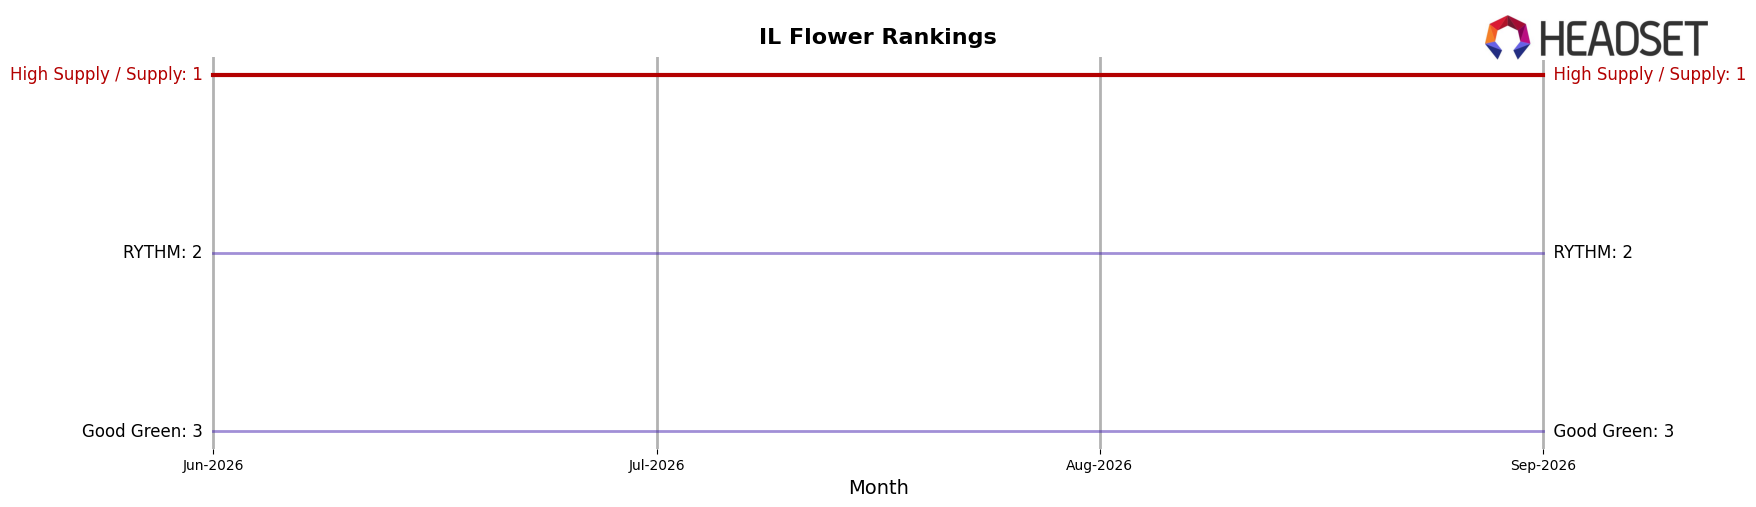
High Supply / Supply sits at rank #1 in IL Flower in September 2026, holding the same #1 position year over year, while RYTHM remains at #2 with a 22.0% year-over-year sales increase and Good Green improved from #4 to #3 alongside a 33.8% gain; meanwhile, The Botanist surged from #27 to #4 with a 495.0% increase and Daze Off declined from #3 to #5 with a 14.2% sales drop, indicating that High Supply / Supply’s static #1 rank amid both upward and downward competitor movements suggests durable category leadership despite accelerating challengers.
Notable Products
Pineapple Under the Sea Pre-Roll (1g) posted the steepest decline in September 2026 at -16.8% and slid to rank 2, while Gastro Pop Pre-Roll (1g) rose 15.2% to hold rank 1; Platinum Gelatti Pre-Roll (1g) added 16.8% at rank 4, putting three Pre-Rolls in the top 10. In contrast, Pineapple Under the Sea (7g) surged 47.1% at rank 3 as Platinum Gelati Shake (7g) fell 13.0% at rank 9, concentrating Flower across three top-10 spots and signaling a tilt toward higher-volume pack sizes over single-stick format. This mix—Pre-Rolls anchoring ranks 1, 2, and 4 while a 7g Flower SKU nears the podium—implies High Supply / Supply is pivoting shelf space toward Flower value packs to offset volatility in flagship Pre-Rolls.
Top Selling Cannabis Brands






Data for this report comes from real-time sales reporting by participating cannabis retailers via their point-of-sale systems, which are linked up with Headset’s business intelligence software. Headset’s data is very reliable, as it comes digitally direct from our partner retailers. However, the potential does exist for misreporting in the instance of duplicates, incorrectly classified products, inaccurate entry of products into point-of-sale systems, or even simple human error at the point of purchase. Thus, there is a slight margin of error to consider. Brands listed on this page are ranked in the top twenty within the market and product category by total retail sales volume.

