.svg)

Sep-2026
Sales
Trend
6-Month
Product Count
SKUs
Avg Price
YoY Sales Change
YoY Price Change


Where to Buy
Highatus is stocked at 377 licensed dispensaries across California, with the deepest coverage in Los Angeles, San Diego, Fresno, San Francisco, and Santa Ana. Search by ZIP code or city below to find the closest one.
Market Insights Snapshot
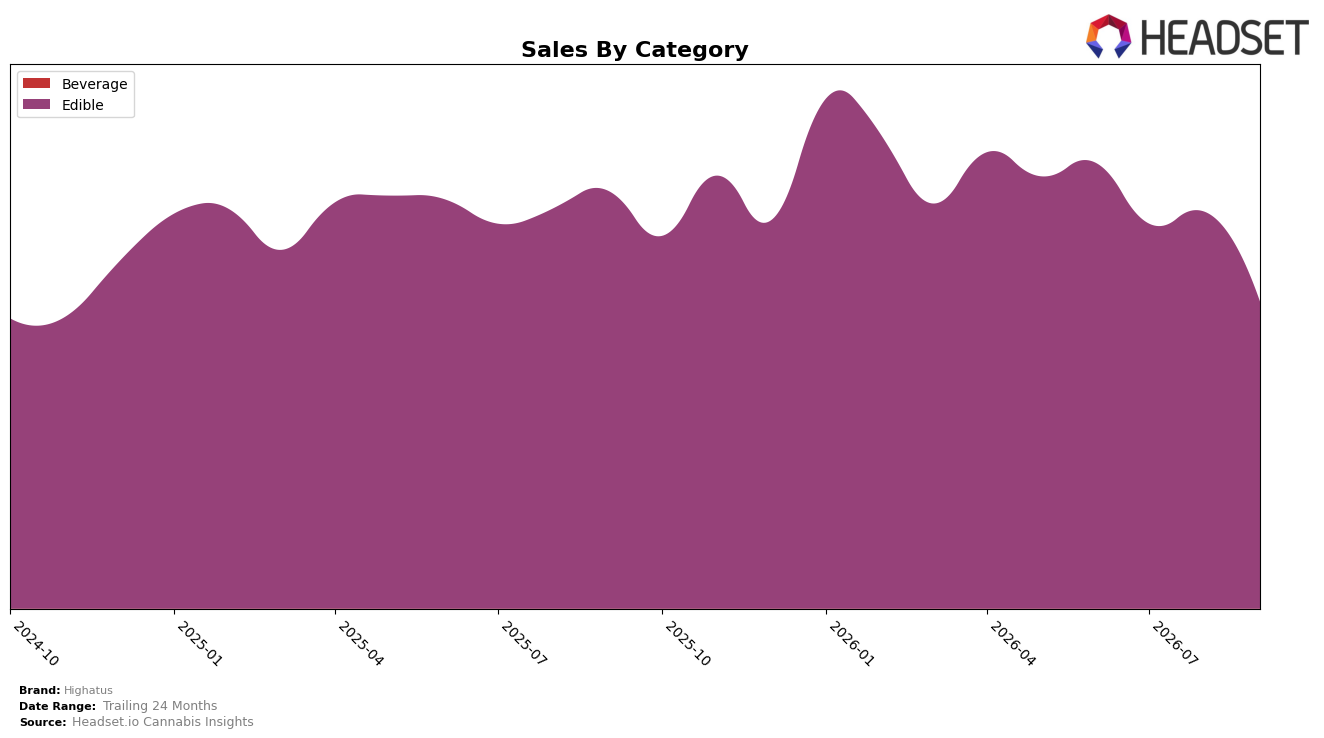
In September 2026, Highatus remained fully concentrated in Edible with a 100.0% category share, while year-over-year sales in Edible declined 26.53% and month-over-month contracted 22.65%. The brand’s average price fell 9.89% YoY to $10.53, and its 24‑month sales trend is down 1.02%, indicating that recent declines are steeper than the longer horizon. With Edible as the only channel and California rank positioned at 12, the combination of a double‑digit price decrease and a 26.53% YoY sales drop implies demand elasticity is not offsetting volume, so concentration risk is amplifying downside when category velocity softens.
The shift toward lower average price by 9.89% alongside a 22.65% MoM sales pullback in September 2026 suggests price moves are not converting into rank gains, as the brand holds rank 12 in California Edible despite a 26.53% YoY sales decline. With 100.0% of sales tied to a single category and a 1.02% 24‑month slide, the short‑term compression outpacing the long‑term trend implies positioning that depends on a narrower price-tier or product format within Edible rather than diversified pack sizes or subtypes; the practical implication is that stabilizing rank 12 will require mix expansion or differentiated pricing architecture, not further across‑the‑board discounts.
Competitive Landscape
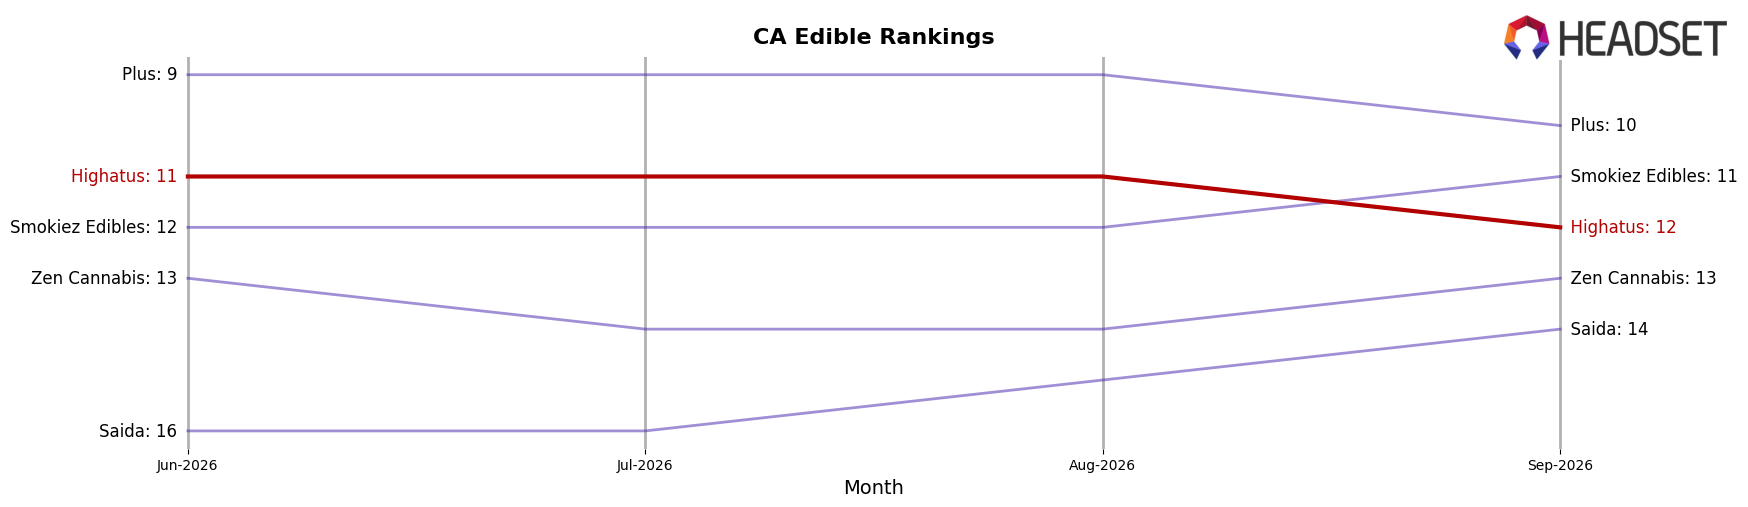
Highatus sits at rank #12 in CA Edible in September 2026, down 2 positions from #10 in September 2025, and off 3 spots from its #9 peak in February 2026; meanwhile, Wyld held #1 year over year despite a 21.97% sales decline and Camino maintained #2 with a 10.39% sales increase, indicating that Highatus’s slip from #11 three months ago to #12 now comes amid a top tier that is either contracting at the very top or growing just below it. With Kanha / Sunderstorm steady at #3 on 11.45% YoY growth while Lost Farm remains #4 despite a 0.56% YoY decline, the stable podium plus mixed growth signals imply Highatus’s two-rank YoY drop is less about broad market churn and more about lagging relative momentum against competitors gaining or holding share nearby.
Notable Products
CBN/CBD/THC 1:1:1 Sour Blueberry Gummies 10-Pack (100mg CBN, 100mg CBD, 100mg THC) led the slide in September 2026 with a -28.9% month-over-month change while holding rank 1, and Sour Pineapple Gummies 10-Pack (100mg) fell -31.9% at rank 3. Across the top ten, eight SKUs are gummies and two are chocolates, and Sour Strawberry Lemonade Gummies 10-Pack (100mg) declined -16.4% at rank 2 as the chocolate entry Chron Bons - Mountain Walker Handcrafted Rosin Chocolate Fudge 10-Pack (100mg) dropped -33.7% at rank 10. The broad double-digit declines concentrated in gummies alongside the weaker chocolate entry imply a demand reset toward fewer, high-velocity edible formats rather than incremental flavor extensions, despite $120,852 in sales for the rank-1 SKU.
Top Selling Cannabis Brands






Data for this report comes from real-time sales reporting by participating cannabis retailers via their point-of-sale systems, which are linked up with Headset’s business intelligence software. Headset’s data is very reliable, as it comes digitally direct from our partner retailers. However, the potential does exist for misreporting in the instance of duplicates, incorrectly classified products, inaccurate entry of products into point-of-sale systems, or even simple human error at the point of purchase. Thus, there is a slight margin of error to consider. Brands listed on this page are ranked in the top twenty within the market and product category by total retail sales volume.

