Jun-2026
Sales
Trend
6-Month
Product Count
SKUs
Avg Price
YoY Sales Change
YoY Price Change
Market Insights Snapshot
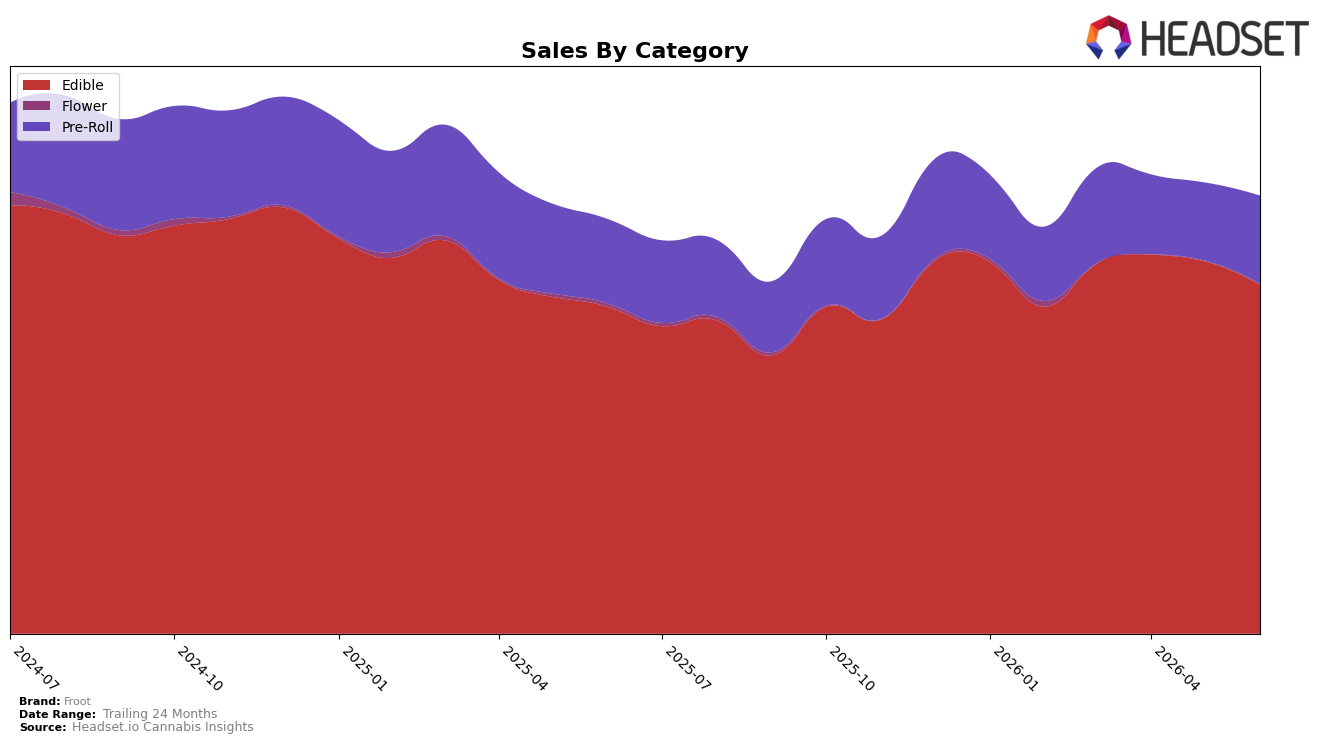
Froot concentrated 77.22% of sales in Edible during June 2026 while holding rank 7 in California Edible, with Edible up 6.63% year over year but down 6.17% month over month; by contrast, Pre-Roll at 20.85% share rose 4.15% year over year and 11.86% month over month. Flower remained a niche at 1.94% share with a 21.35% year-over-year decline but a 1.25% month-over-month uptick, and brandwide average price fell 4.91% year over year to $8.81 as total brand sales increased 5.38% year over year; this combination implies June 2026 growth leaned on volume in Edible while momentum within Pre-Roll offset Edible’s month-over-month pullback.
The mix shift toward Pre-Roll’s 11.86% month-over-month gain alongside Edible’s 6.17% month-over-month dip suggests trading into faster-turn formats to protect velocity at rank 7 in California, while keeping Edible as the anchor at 77.22% share. Given a 26.24% two-year sales contraction but a 5.38% year-over-year rebound and a 4.91% year-over-year price decrease, the pattern implies Froot is positioning on accessible price points in Edible to rebuild volume, using Pre-Roll growth to hedge category cyclicality and contain risk from Flower’s 21.35% year-over-year decline.
Competitive Landscape
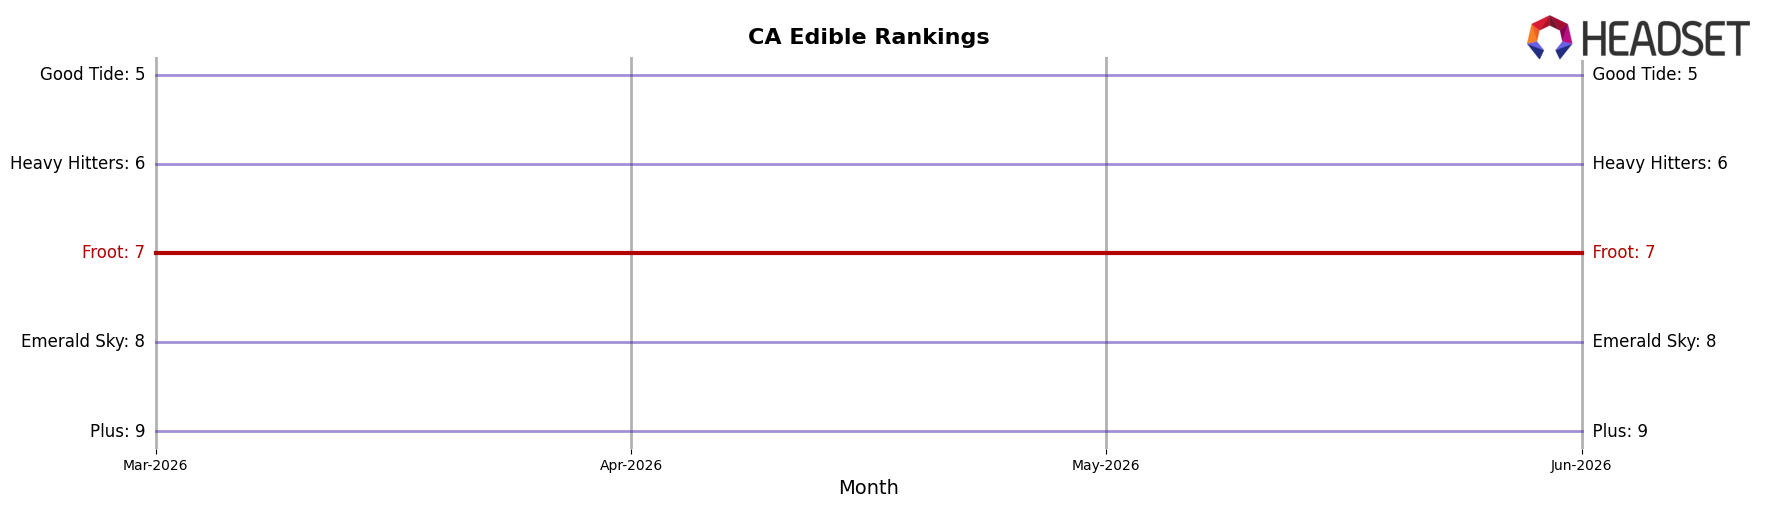
Froot sits at rank #7 in CA Edible in June 2026, unchanged YoY from rank #7, while its peak rank of #5 in February 2025 has not been revisited across the last three months at #7, indicating a flat rank trajectory even as category leaders shift. Against this static position, Wyld holds #1 but with a -1.92% YoY sales change, whereas Camino remains #2 with +12.91% YoY sales growth, and Good Tide is #5 with +28.46% YoY sales growth, showing that Froot’s steady rank contrasts with competitors moving up on double-digit gains and a top player contracting by a low single-digit percentage. The pattern implies that Froot’s unchanged rank masks erosion risk from mid-pack brands accelerating at +10% to +28% while leadership softness near -2% could open share, positioning the brand at a strategic crossroads rather than on an upward path.
Notable Products
Pineapple Express Gummies 10-Pack (100mg) posted the steepest decline at -14.3% MoM while sliding to rank 7, and Sativa Sour Lemon Chews 10-Pack (100mg) fell -13.1% at rank 10, indicating sour and strain-labeled citrus profiles are losing velocity relative to fruit-forward chews. At the top, Hybrid Blue Razz Dream Chews 10-Pack (100mg) held rank 1 despite a -3.2% MoM dip, whereas M.Y. Sleep - THC/CBN/Melatonin 5:2:2 Mellow Berry Gummies 20-Pack (100mg THC, 40mg CBN, 40mg Melatonin) dropped -10.4% at rank 2, suggesting sleep-formulated value packs are softening more than classic single-flavor chews. Eight of the top ten are Edible chews or gummies within 10-pack formats, and Strawberry Chews 10-Pack (100mg) was the lone bright spot at +8.2% MoM and rank 8 off a $61,841 base, pointing to standard fruit SKUs stabilizing mix even as functional or strain-themed variants contract. The pattern implies Froot’s commercial direction is consolidating around familiar fruit flavors in core 10-pack edibles while larger-format and strain-branded gummies face demand fatigue.
Top Selling Cannabis Brands
Data for this report comes from real-time sales reporting by participating cannabis retailers via their point-of-sale systems, which are linked up with Headset’s business intelligence software. Headset’s data is very reliable, as it comes digitally direct from our partner retailers. However, the potential does exist for misreporting in the instance of duplicates, incorrectly classified products, inaccurate entry of products into point-of-sale systems, or even simple human error at the point of purchase. Thus, there is a slight margin of error to consider. Brands listed on this page are ranked in the top twenty within the market and product category by total retail sales volume.

