Jun-2026
Sales
Trend
6-Month
Product Count
SKUs
Avg Price
YoY Sales Change
YoY Price Change
Market Insights Snapshot
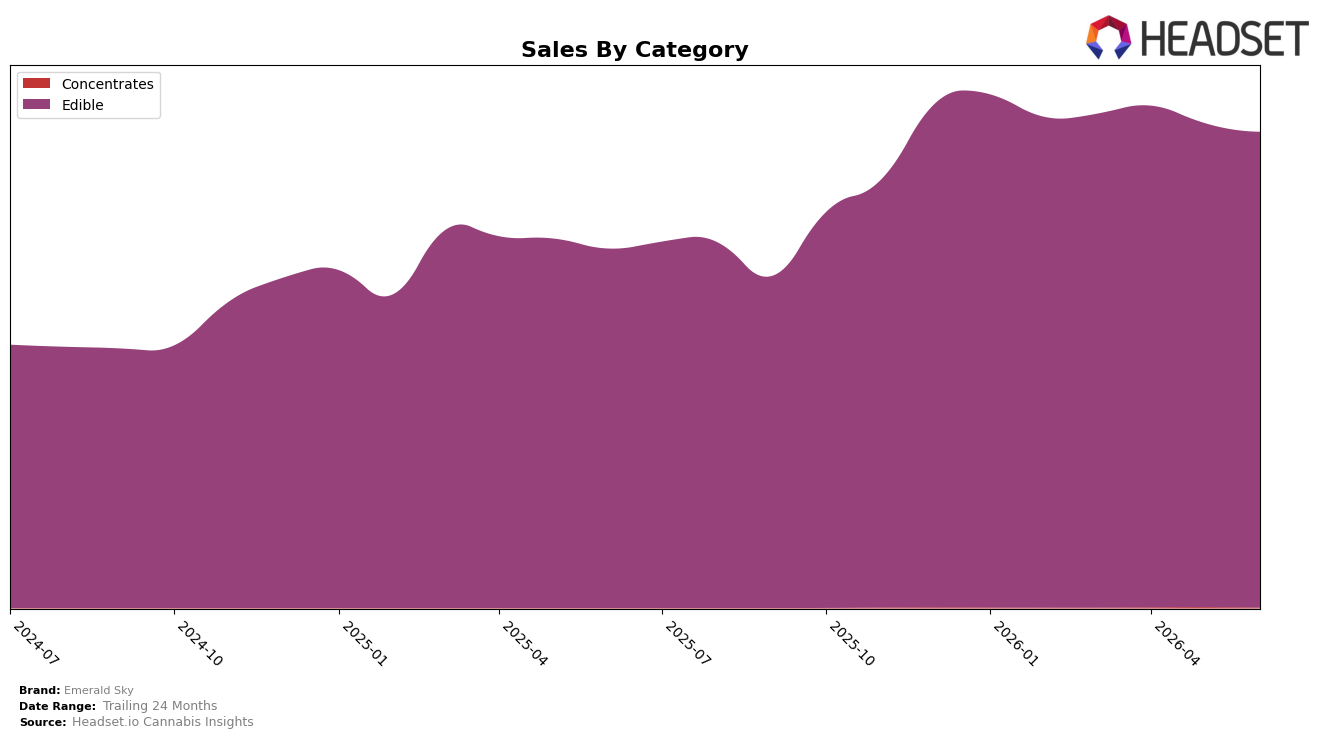
Emerald Sky’s category mix in June 2026 is overwhelmingly concentrated in Edible at 99.92% share, with Concentrates at 0.08% after a month-over-month drop of 50.06% and no year-over-year baseline, while Edible grew 32.42% year over year but slipped 1.72% month over month. Average price rose 5.97% year over year to $9.88, and the brand ranked 8 in Edible in California, indicating that the slight month decline in Edible alongside a price increase did not dislodge its category standing.
The mix indicates a deliberate specialization: with 99.92% in Edible and a 32.53% brand-level year-over-year sales lift, Emerald Sky is effectively trading minor month softness of 1.72% in its core for sustained share concentration, positioning the brand as an Edible-first player rather than pursuing breadth. The 8 rank in Edible in California alongside a 5.97% price increase suggests headroom to optimize margin without material share dilution, implying the near-zero exposure to Concentrates (0.08% share and a 50.06% month decline) is an intentional de-prioritization to protect focus and pricing power within Edible.
Competitive Landscape
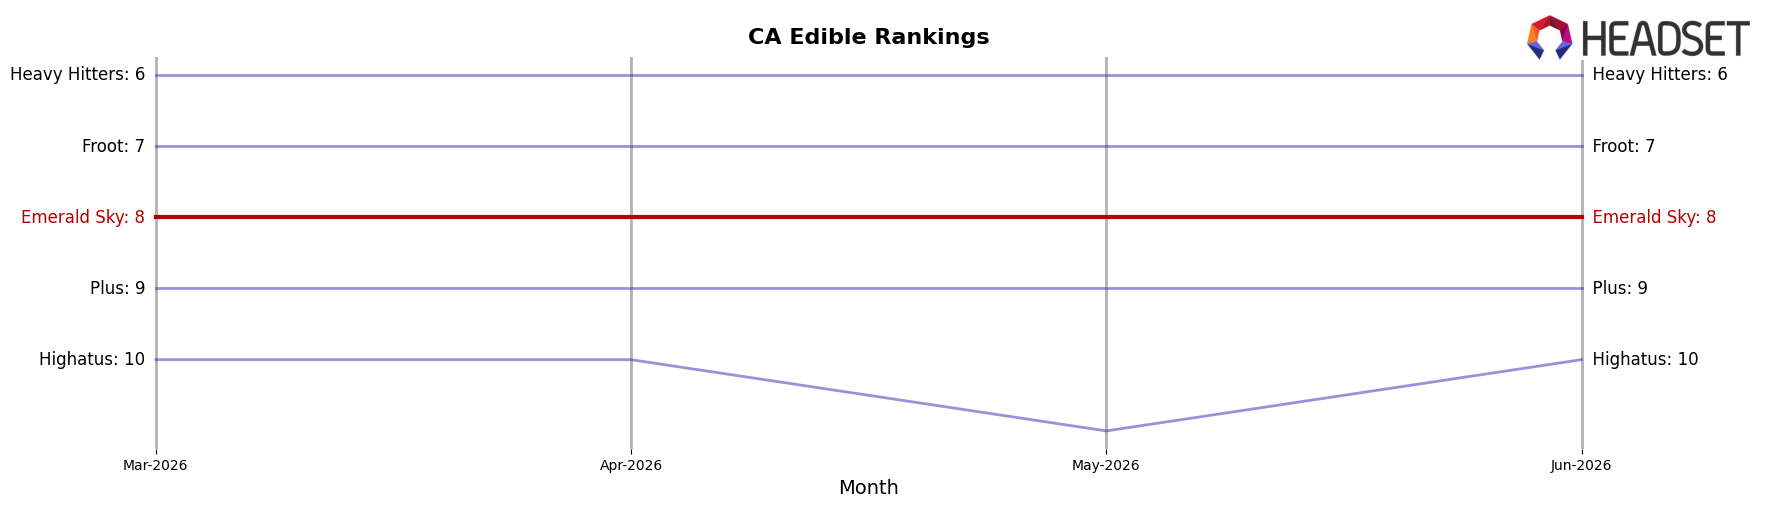
Emerald Sky sits at rank #8 in CA Edible for June 2026, unchanged YoY from #8, and flat versus March 2026 at #8, while its peak of #7 in February 2026 marked only a one-spot improvement before reverting. In contrast, Wyld held #1 both YoY and in June 2026 despite a -1.9% YoY sales change, and Good Tide maintained #5 with a 28.5% YoY sales increase, indicating upward momentum above Emerald Sky’s stationary #8. Meanwhile, Camino stayed at #2 with 12.9% YoY sales growth and Kanha / Sunderstorm remained #3 with 10.9% YoY growth, widening the gap from Emerald Sky’s zero-rank-change baseline; the pattern implies Emerald Sky’s stable position is drifting toward a relative share squeeze unless it converts brief rank spikes like February 2026’s #7 into sustained gains.
Notable Products
Indica Peanut Butter Dark Chocolate Cups 10-Pack (100mg) posted the steepest decline at -10.23% while holding rank 6, and Hybrid Melon Thunder Gummy (100mg) slipped -7.51% yet remained rank 1. Grape Quake High Dose Gummy (100mg) was nearly flat at -0.46% at rank 2, while Strawberry Slam Gummy (100mg) gained 4.20% at rank 4. With all top 10 SKUs in Edible and chocolate cups weakening as gummies at ranks 1–5 consolidate positions, the mix points to Emerald Sky leaning further into gummy-led velocity over confection variants.
Top Selling Cannabis Brands
Data for this report comes from real-time sales reporting by participating cannabis retailers via their point-of-sale systems, which are linked up with Headset’s business intelligence software. Headset’s data is very reliable, as it comes digitally direct from our partner retailers. However, the potential does exist for misreporting in the instance of duplicates, incorrectly classified products, inaccurate entry of products into point-of-sale systems, or even simple human error at the point of purchase. Thus, there is a slight margin of error to consider. Brands listed on this page are ranked in the top twenty within the market and product category by total retail sales volume.

