May-2026
Sales
Trend
6-Month
Product Count
SKUs
Avg Price
YoY Sales Change
YoY Price Change
Market Insights Snapshot
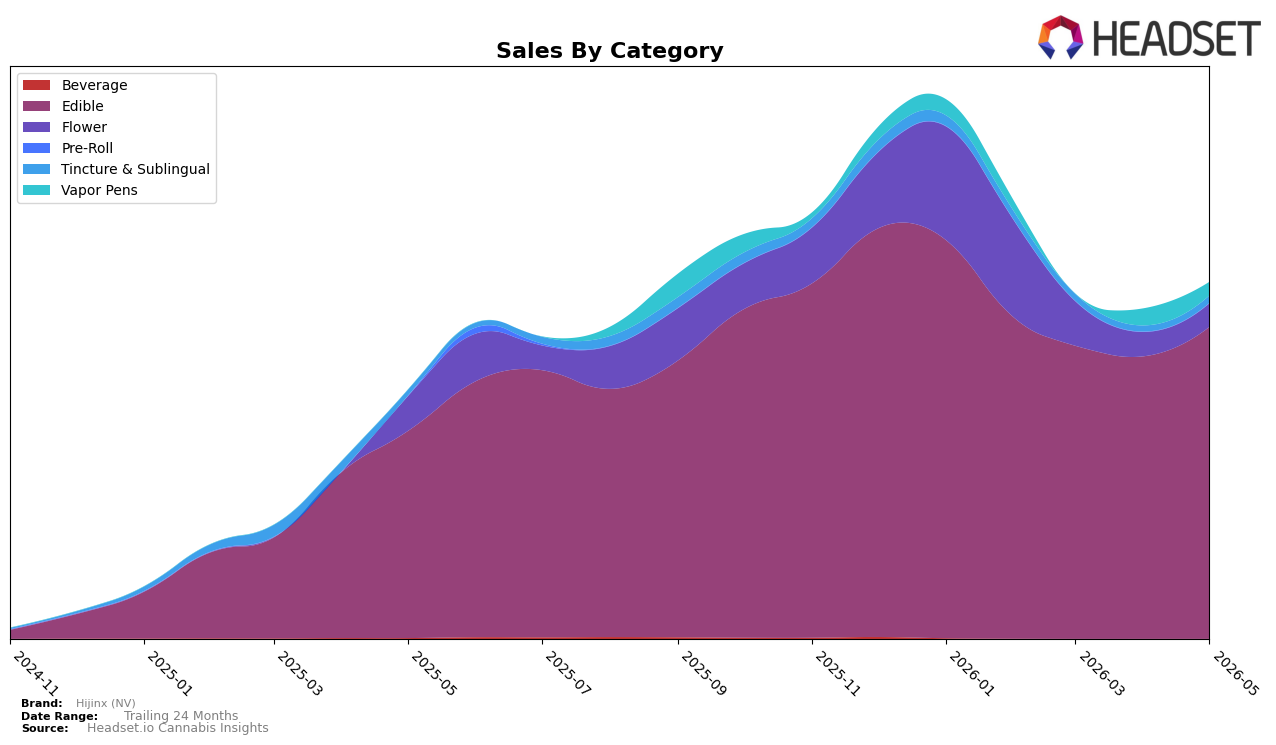
In May 2026, Hijinx (NV) concentrated 87.74% of sales in Edible, where year-over-year growth was 50.88% and month-over-month growth was 10.42%, while Flower contracted to a 6.54% share with a -32.30% YoY and -3.10% MoM decline. Vapor Pens slipped to a 3.71% share with a -21.17% MoM drop and no reported YoY basis, whereas Tincture & Sublingual, at 2.00% share, advanced 28.05% YoY and 24.34% MoM. With an average price up 1.72% YoY to $9.998 and Edible pricing at $9.14, the mix indicates volume-led gains rather than price-driven expansion; the pattern implies Hijinx (NV) is deepening an Edible-led footprint while trimming exposure to declining Flower.
The 87.74% Edible weight paired with a rank of 17 in Edible in Illinois suggests concentration where the brand already has measurable placement, and the 24.34% MoM rise in Tincture & Sublingual alongside a -21.17% MoM move in Vapor Pens points to selective investment in formats adjacent to Edibles rather than inhalables. The 50.88% YoY surge within Edibles versus a -32.30% YoY fall in Flower signals portfolio pruning toward categories with faster turns and lower price points, implying a positioning strategy centered on accessible, repeatable Edible purchases while using Tincture & Sublingual as a secondary growth lane.
Competitive Landscape
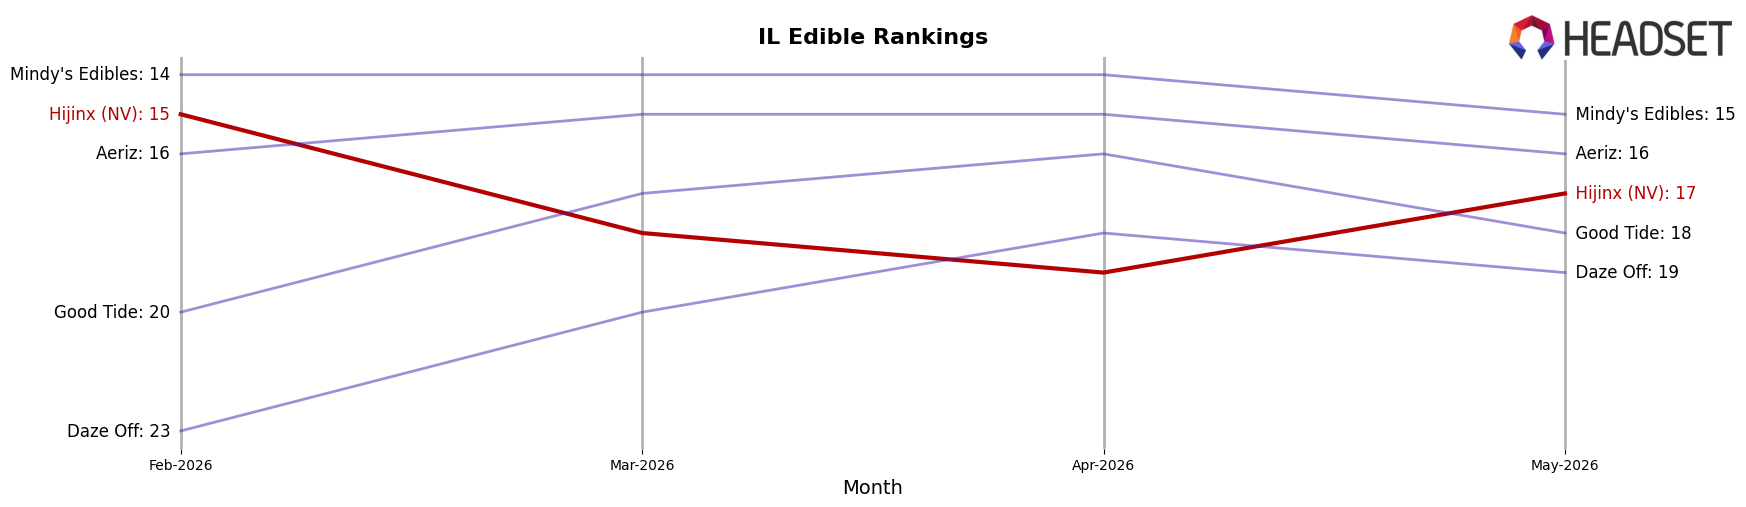
Hijinx (NV) is currently ranked #17 in Illinois Edible, improving 9 positions year over year from #26, but slipping 2 spots since February 2026 from #15 to #17 as it moved off its January 2026 peak of #14; meanwhile, Incredibles advanced from #2 to #1 with an 88.9% YoY sales increase while Wyld declined from #1 to #2 amid a 17.0% YoY sales contraction, and Gron / Grön surged from #22 to #4 on a 266.1% YoY lift, indicating that Hijinx (NV)’s ranking path—up 9 places YoY yet down 2 ranks in the latest quarter—implies stabilization below the top tier unless near-term velocity accelerates against faster-moving leaders.
Notable Products
Space Chunk OG RSO Gummies 2-Pack (100mg) fell 90.4% month over month and still held rank 1, while the CBD/THC 1:1 Chill Space Chunk RSO Gummies 2-Pack (100mg CBD, 100mg THC) surged 59.9% to rank 2. Five of the top ten SKUs are Space Chunk-branded Edibles, and three of the top five are functional 1:1 or CBN formats, indicating a pivot toward targeted effect segments even as the flagship space saw a steep pullback. This mix implies Hijinx (NV) is leaning into differentiated formulations to buffer volatility at the very top of the lineup.
Space Chunk OG Minis Gummies 10-Pack (100mg) dropped 37.2% at rank 4, and the CBN/THC 1:1 Sleep Space Chunk OG RSO Gummy (50mg CBN, 50mg THC) declined 14.7% at rank 5, yet Space Chunk Sugar Free RSO Gummies 10-Pack (100mg) climbed 49.9% at rank 8 on a lower base and kept category breadth intact. Flower presence was limited to Pineapple Donut (3.5g) at rank 9 with a 17.0% decline and just $16,284 in May 2026 sales, underscoring Edibles concentration and reduced cross-category balance. The pattern implies a brand strategy consolidating around Edibles with functional variants to drive resilience despite flagship volatility.
Top Selling Cannabis Brands
Data for this report comes from real-time sales reporting by participating cannabis retailers via their point-of-sale systems, which are linked up with Headset’s business intelligence software. Headset’s data is very reliable, as it comes digitally direct from our partner retailers. However, the potential does exist for misreporting in the instance of duplicates, incorrectly classified products, inaccurate entry of products into point-of-sale systems, or even simple human error at the point of purchase. Thus, there is a slight margin of error to consider. Brands listed on this page are ranked in the top twenty within the market and product category by total retail sales volume.

