Jun-2026
Sales
Trend
6-Month
Product Count
SKUs
Avg Price
YoY Sales Change
YoY Price Change
Market Insights Snapshot
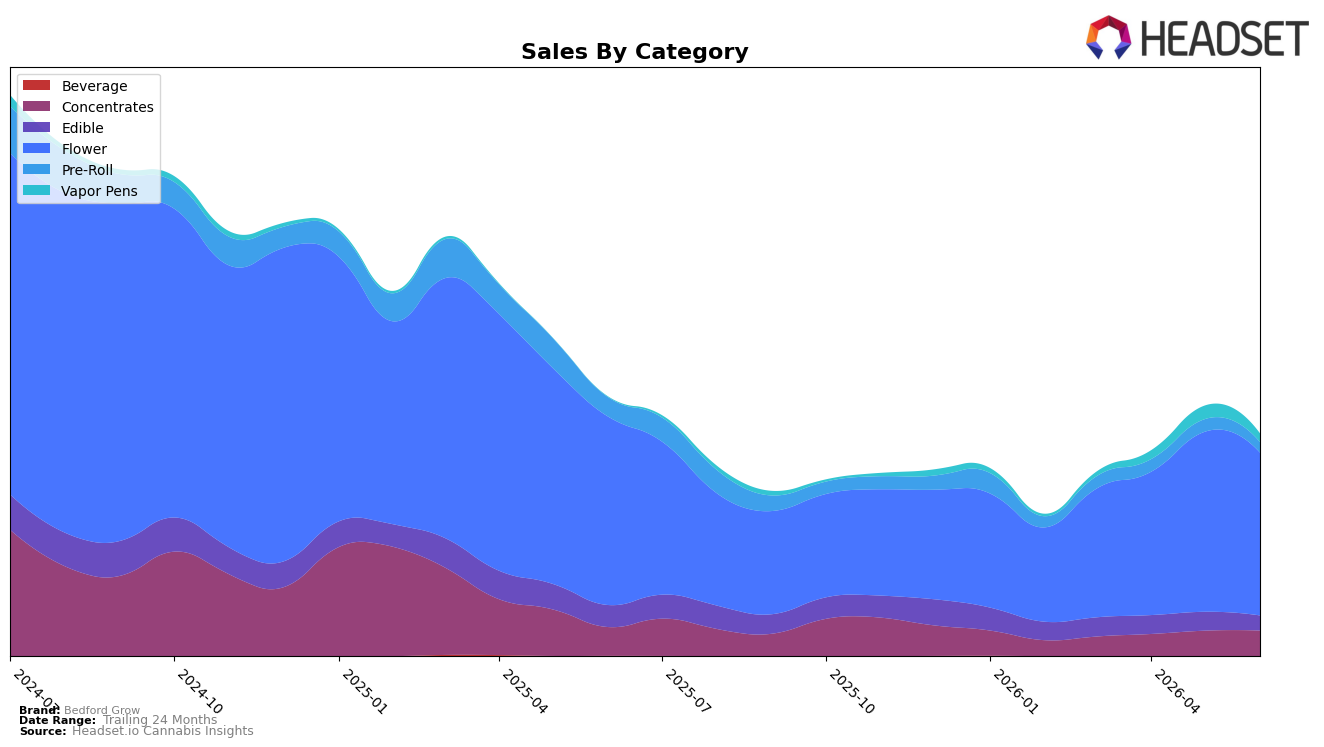
Bedford Grow’s mix in June 2026 tilted heavily to Flower at 73.46% share with a year-over-year decline of 13.59% and a month-over-month decline of 9.56%, while Concentrates held 11.43% share with a 11.23% YoY decline but a 0.52% MoM uptick. Edible contracted to 6.68% share with a 31.90% YoY drop and a 20.36% MoM decline, and Pre-Roll slipped to 4.66% share with a 46.11% YoY decline and a 16.37% MoM decline; Vapor Pens, despite a 1,813.38% YoY jump, fell 37.15% MoM and remained just 3.78% of sales. With brand-wide sales down 14.28% YoY and average price up 10.996%, this pattern implies Bedford Grow is over-indexed to a contracting Flower base in Illinois while small but volatile categories like Vapor Pens are too undersized to offset mix pressure in the near term.
The shift suggests positioning risk tied to premiumization and category concentration: Flower’s large share plus a 9.56% MoM drop exposes volume sensitivity as prices rise 10.996% YoY, while Edible’s 20.36% MoM and 31.90% YoY declines signal weak replenishment in value-oriented formats. The modest 0.52% MoM growth in Concentrates alongside a 11.23% YoY dip indicates a possible stabilization pocket, but the 37.15% MoM contraction in Vapor Pens after outsized YoY expansion points to inconsistent traction; together with a Flower rank of 17 in Illinois, the mix implies Bedford Grow’s current stance prioritizes depth in Flower over breadth, limiting defensiveness against shifting consumer spend toward lower-price or convenience-led segments.
Competitive Landscape
Bedford Grow sits at rank #17 in IL Flower in June 2026, slipping 1 position year over year from #16 and rising 6 positions since March 2026 when it was #23; against this, peer momentum is polarized as High Supply / Supply held #1 year over year while expanding sales by 32.1%, and RYTHM stayed at #2 despite a 5.2% sales contraction. The brand’s historical ceiling of #10 in October 2024 contrasts with June 2026’s #17, while competitor reshuffling shows Good Green climbed from #4 to #3 with 30.9% sales growth and Simply Herb slid from #3 to #4 on a 16.8% decline; meanwhile, &Shine surged from #10 to #5 alongside a 28.5% lift. The pattern implies Bedford Grow’s mid-pack rebound from #23 to #17 is cyclical rather than structural, and reclaiming the prior #10 peak will require outpacing competitors that are either consolidating share at the top or accelerating upward through double-digit growth.

Notable Products
Milk Chocolate Bar 10-Pack (100mg) posted the steepest decline in June 2026 at -26.1% MoM while dropping behind Flower leaders that held ranks 1 and 3, signaling softness in Edibles as Flower steadied. Banana Junky (1g) rose 6.2% MoM at rank 1 versus Sugar Shack (1g) at rank 3 with -3.6%, and four of the top ten are Flower SKUs, pointing to heavier reliance on inhalables over ingestibles. Super Buff Cherry Pre-Roll (1g) climbed 23.7% MoM at rank 7, and Pre-Rolls occupy ranks 5–7, suggesting momentum in value-driven formats even as the top Vapor Pen sits at rank 8 without a reported MoM rate. The pattern implies Bedford Grow is consolidating share around Flower and Pre-Rolls while Edibles retreat, rebalancing product mix toward faster-turn inhalables despite one Edible still generating $12,899.
Top Selling Cannabis Brands
Data for this report comes from real-time sales reporting by participating cannabis retailers via their point-of-sale systems, which are linked up with Headset’s business intelligence software. Headset’s data is very reliable, as it comes digitally direct from our partner retailers. However, the potential does exist for misreporting in the instance of duplicates, incorrectly classified products, inaccurate entry of products into point-of-sale systems, or even simple human error at the point of purchase. Thus, there is a slight margin of error to consider. Brands listed on this page are ranked in the top twenty within the market and product category by total retail sales volume.

