Jun-2026
Sales
Trend
6-Month
Product Count
SKUs
Avg Price
YoY Sales Change
YoY Price Change
Market Insights Snapshot
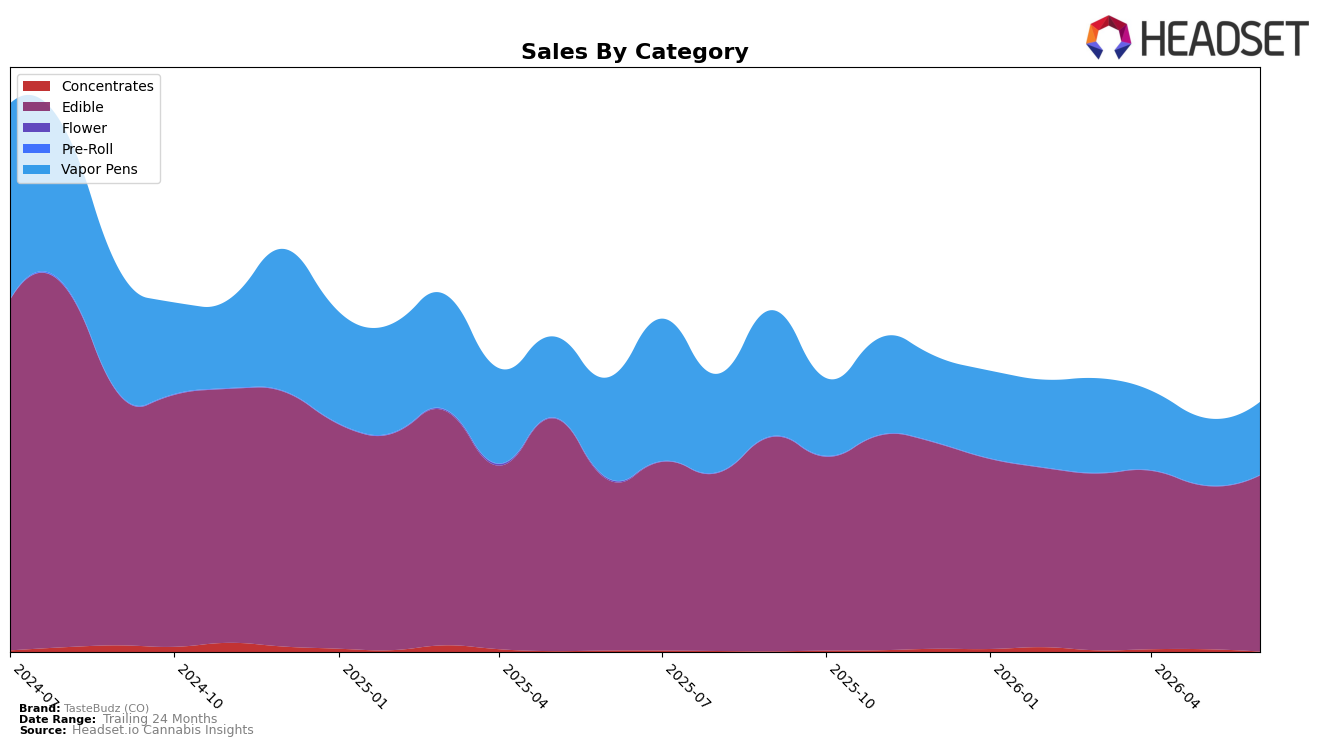
In June 2026, Edible held 70.64% share with year-over-year growth of 3.24% and month-over-month growth of 7.77%, while Vapor Pens accounted for 29.18% share but declined 27.96% year over year despite an 8.31% month-over-month lift. Concentrates slipped to 0.19% share with a 69.47% year-over-year drop and an 83.68% month-over-month decline, and the average price across the portfolio fell 16.23% year over year to $17.90. Within Colorado Edibles, the brand sat at rank 7, implying that June momentum is concentrated in the largest category even as total brand sales were down 9.01% year over year; the pattern suggests a pivot toward Edibles stability offsetting Vapor Pens contraction.
The mix shift toward Edibles at 70.64% share alongside a 7.77% month-over-month uptick, combined with a 27.96% year-over-year decline in Vapor Pens at 29.18% share, positions TasteBudz (CO) as more defensively anchored in value-oriented, lower-price products, reinforced by a 16.23% year-over-year price decrease. Holding rank 7 in Colorado Edibles while total brand sales fell 9.01% year over year implies that competitive standing is more durable where the brand concentrates, and that recovering pen velocity month over month (+8.31%) is insufficient to offset structural year-over-year softness; the implication is a category-led positioning strategy prioritizing Edibles scale over breadth as Concentrates, down 83.68% month over month and 69.47% year over year at 0.19% share, recedes to negligible relevance.
Competitive Landscape
TasteBudz (CO) ranks #7 in CO Edible in June 2026, improving 1 place from #8 year over year, while holding steady versus March 2026 at #7; the brand’s peak of #5 in January 2025 sits 2 positions above today, indicating mid-tier stability rather than recovery to prior highs. Competitively, Wyld held #1 year over year despite a 16.6% YoY sales decline, and Wana stayed at #2 with a 0.5% YoY dip, whereas Dialed In Gummies maintained #3 with a 3.7% YoY gain—so TasteBudz (CO)’s 1-rank YoY climb comes as leaders either contract or grow modestly. With Good Tide anchored at #5 despite a 25.5% YoY decline and Ript fixed at #4 with a 0.9% YoY increase, the gap from #7 to the top 5 reflects share that is turbulent above but not yet translating into upward rank movement for TasteBudz (CO); this trajectory implies incremental gains are attainable if the brand can convert competitor softness into rank share, but current data points to a holding pattern around #7 rather than a return to #5.

Notable Products
Hybrid Assorted Fruit Flavors Rosin Gummies 10-Pack (100mg) posted the largest movement with an 89% month-over-month gain and climbed to rank 5, while Sour Green Slapple Gummies 10-Pack (100mg) fell 14% to rank 2. Nightly Rituals - CBD/CBN/THC 1:1:1 Blueberry Lavender Rosin Gummies 20-Pack (100mg CBD,100mg CBN,100mg THC) rose 22% to hold rank 1, and CBD/THC 50:1 Hybrid Raspberry Lemonade Gummies 20-Pack (1000mg CBD, 20mg THC) slipped 10% yet stayed at rank 3. With eight of the top ten SKUs in Edible gummies and CBD-leaning ratios mixed with live rosin formats, the pattern implies TasteBudz (CO) is tilting assortment toward higher-potency rosin and functional CBD blends to secure premium shelf space.
Top Selling Cannabis Brands
Data for this report comes from real-time sales reporting by participating cannabis retailers via their point-of-sale systems, which are linked up with Headset’s business intelligence software. Headset’s data is very reliable, as it comes digitally direct from our partner retailers. However, the potential does exist for misreporting in the instance of duplicates, incorrectly classified products, inaccurate entry of products into point-of-sale systems, or even simple human error at the point of purchase. Thus, there is a slight margin of error to consider. Brands listed on this page are ranked in the top twenty within the market and product category by total retail sales volume.

