.svg)

Sep-2026
Sales
Trend
6-Month
Product Count
SKUs
Avg Price
YoY Sales Change
YoY Price Change


Where to Buy
Cresco Labs is stocked at 656 licensed dispensaries across Michigan, Illinois, and 5 other states, 163 of them in Michigan, with the deepest coverage in New Buffalo, Monroe, Detroit, Grand Rapids, and Ypsilanti. Search by ZIP code or city below to find the closest one, or filter by product type if you are after a specific format.
Market Insights Snapshot
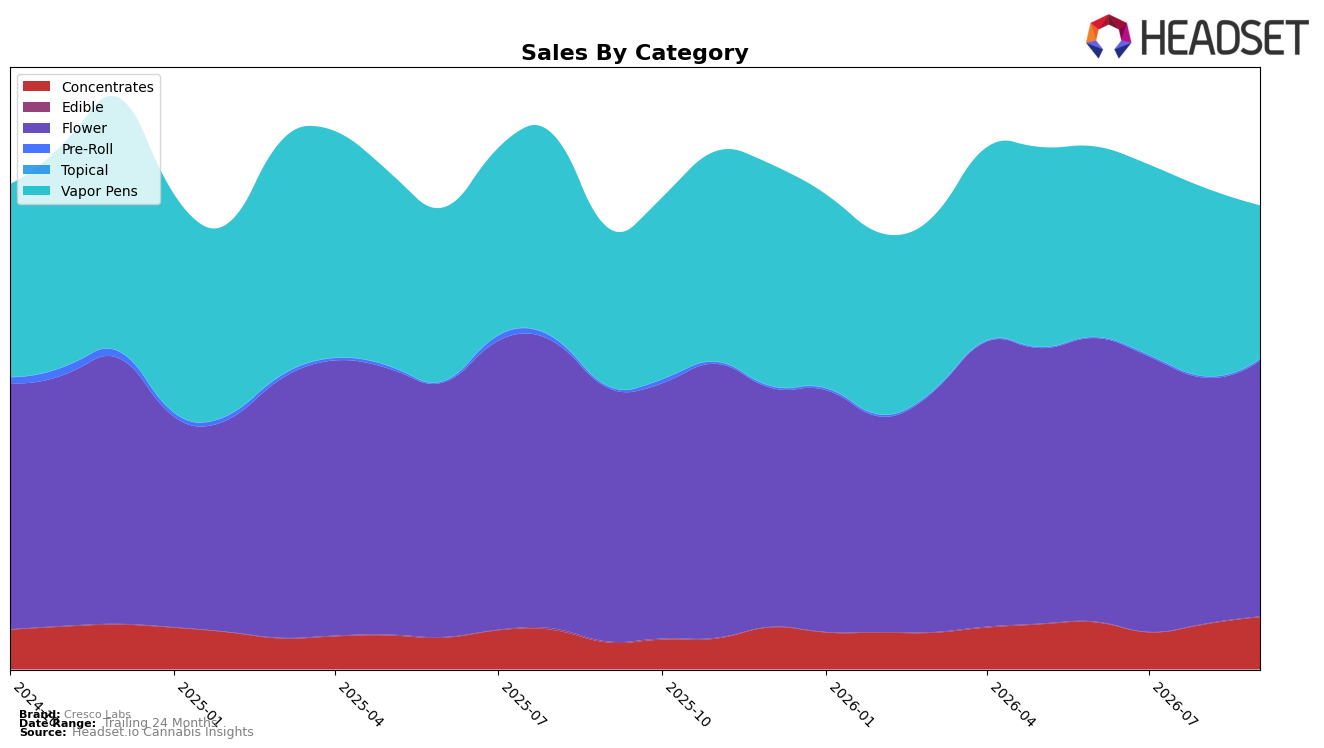
Cresco Labs concentrated its September 2026 mix in Flower at 55.25% share (ranked 8th in Massachusetts Flower) and Vapor Pens at 33.13% share, with Concentrates expanding to 11.24%. Flower posted 0.91% YoY and 3.97% MoM growth while Vapor Pens declined 2.95% YoY and 18.53% MoM; against that, Concentrates surged 94.48% YoY and 16.18% MoM. Despite total brand sales up 5.13% YoY and the average price down 14.86% YoY, the sharp MoM pullback in Vapor Pens alongside gains in Flower and Concentrates implies the month’s stability relied on core inhalables, with a pivot toward higher-velocity Flower and a recovering Concentrates line supporting mix resilience at an 8th-place Flower rank.
The shift toward Flower (+3.97% MoM) and Concentrates (+16.18% MoM) while Vapor Pens fell (-18.53% MoM) points to price-sensitive demand gravitating to lower-ticket Flower (average price $19.96) and exploratory upsell in Concentrates (average price $36.99). With overall brand sales up 5.13% YoY but down 12.75% over 24 months, and average price down 14.86% YoY, the mix indicates Cresco Labs is trading volume for price to defend share in Flower and rebuild a secondary growth pillar in Concentrates; this positioning implies near-term emphasis on value-led Flower to anchor rank and selective premiumization in Concentrates to diversify revenue without leaning on a weakening Vapor Pens contribution.
Competitive Landscape
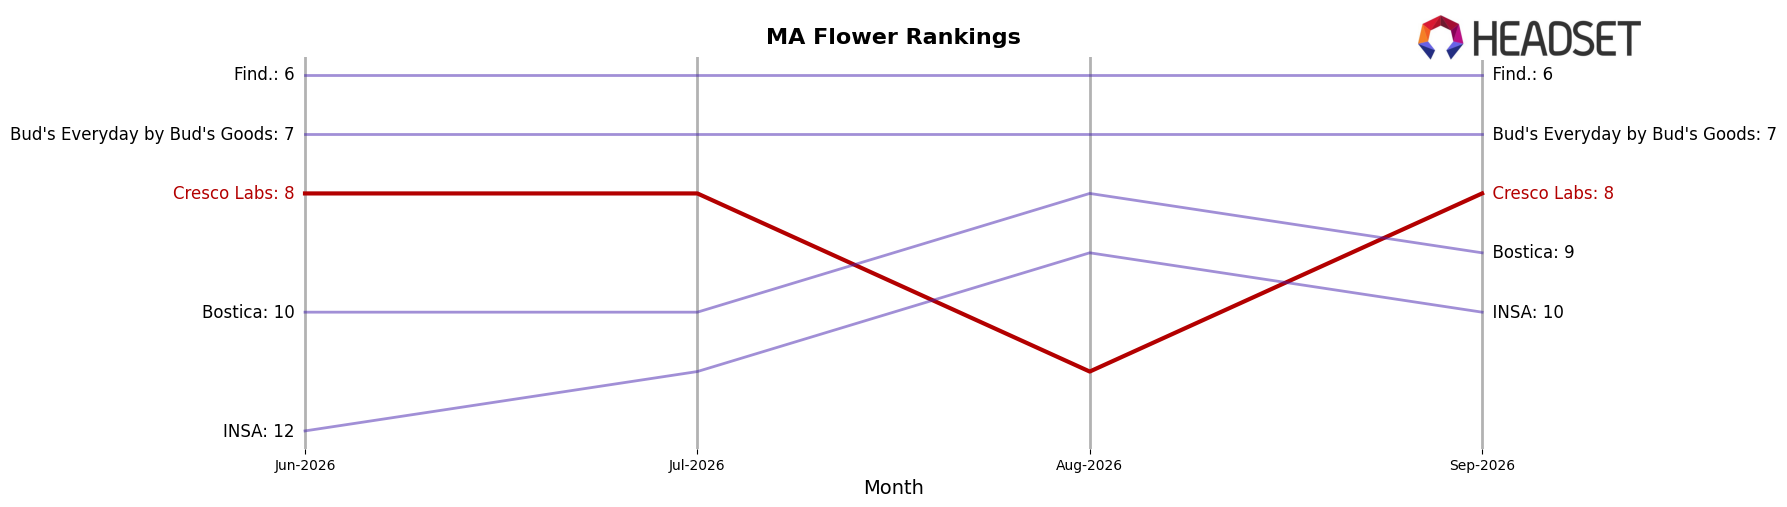
Cresco Labs sits at rank #8 in Massachusetts Flower in September 2026, improving 11 positions year over year from #19 to #8, and matching its three-month standing of #8 while hitting a peak rank of #8 in September 2026; in contrast, Perpetual Harvest moved to #1 from #4 with 124.1% year-over-year sales growth, and Farmer's Cut advanced to #2 from #2 with 37.5% year-over-year growth, indicating Cresco Labs’ rank gains are outpaced at the very top even as it consolidates a top-10 foothold. The divergence is further visible as Simply Herb holds #3 after sliding from #1 alongside a 16.6% sales decline, while High Supply / Supply sits at #4 from #3 with a 13.6% decline, implying Cresco Labs’ ascent owes more to steady placement than outsized momentum versus the fastest risers and positions it for share stabilization rather than rapid leapfrogging.
Notable Products
Gush Mints (3.5g) posted the steepest downturn in September 2026 with a -62.3% month-over-month change while sliding to rank 3, and Pineapple Under The Sea (3.5g) also contracted by -44.5% at rank 8, indicating a sharp mid-pack reset despite two new leaders. Billy Ocean (3.5g) entered at rank 1 and Chimera Junky (3.5g) at rank 2, as Flower captured all top 10 slots and at least six of those are 3.5g SKUs, pointing to a format-heavy lineup that is concentrating volume in standard-eighth offerings. The presence of Grapelato (3.5g) at rank 4 alongside GastroPop (3.5g) at rank 10, even as White Mocha (2.83g) sits at rank 9, suggests limited traction for sub-eighth sizes versus eighths by both rank and the -62.3% and -44.5% corrections among select 3.5g items. Taken together, the mix implies Cresco Labs is pivoting toward a narrower set of flagship eighths while allowing underperforming strains to cycle down, concentrating execution behind a few front-running Flower SKUs.
Top Selling Cannabis Brands






Data for this report comes from real-time sales reporting by participating cannabis retailers via their point-of-sale systems, which are linked up with Headset’s business intelligence software. Headset’s data is very reliable, as it comes digitally direct from our partner retailers. However, the potential does exist for misreporting in the instance of duplicates, incorrectly classified products, inaccurate entry of products into point-of-sale systems, or even simple human error at the point of purchase. Thus, there is a slight margin of error to consider. Brands listed on this page are ranked in the top twenty within the market and product category by total retail sales volume.

