Jun-2026
Sales
Trend
6-Month
Product Count
SKUs
Avg Price
YoY Sales Change
YoY Price Change
Market Insights Snapshot
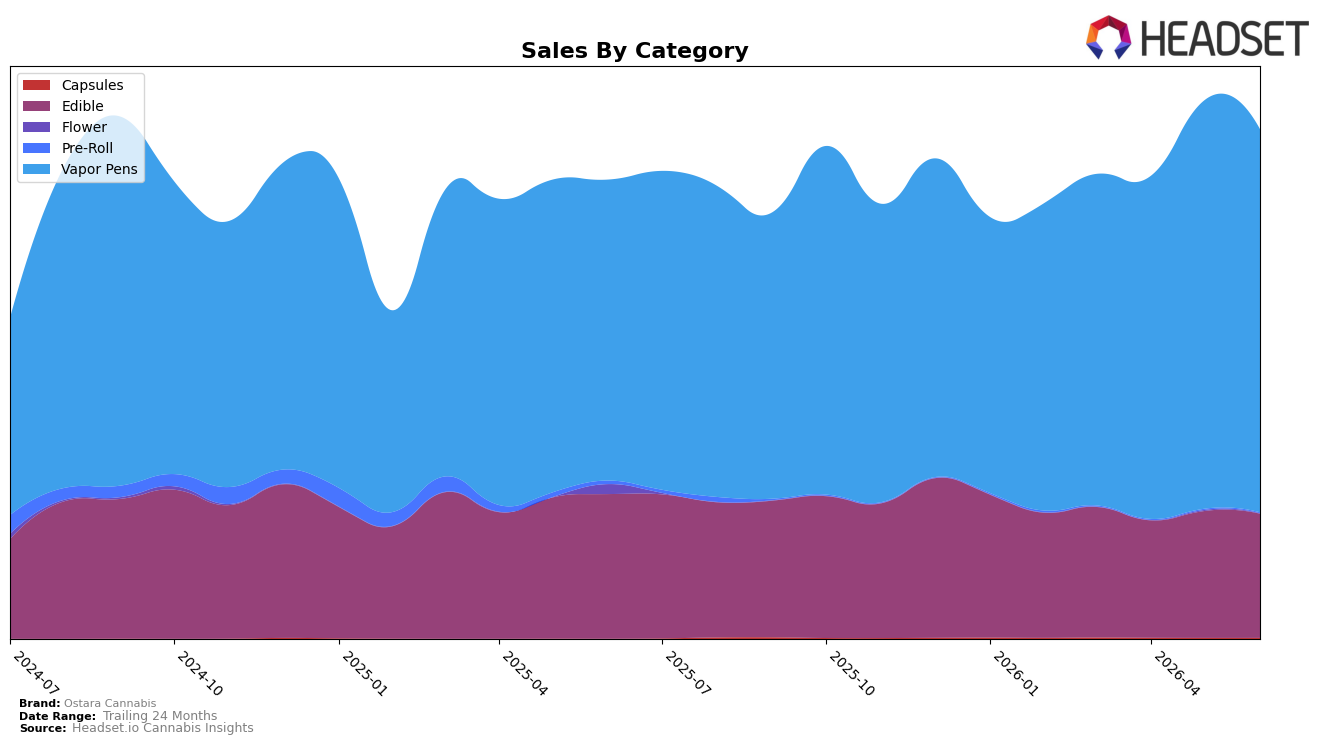
Ostara Cannabis concentrated 75.34% of June 2026 sales in Vapor Pens with a 27.34% year-over-year increase but a 6.24% month-over-month decline, while Edible held 24.37% share with a 14.17% year-over-year drop and a 2.14% month-over-month decline. Niche lines diverged: Capsules reached 0.18% share on 772.80% year-over-year growth and a 0.86% month-over-month uptick, whereas Pre-Roll slid to 0.11% share with an 81.42% year-over-year contraction and a 27.65% month-over-month decrease. With Vapor Pens ranked 10th in Missouri in June 2026 and the brand’s overall average price rising 2.39% year over year to $27.02, the mix signals a high-penetration, price-tolerant core in Vapor Pens that offsets softness in Edible.
The shifting weights imply a deliberate trade-off: dependence on a single category that grows 27.34% year over year but shrinks 6.24% month over month increases near-term volatility, while retreat in Edible at 14.17% year-over-year decline and 2.14% month-over-month decline weakens basket diversity. The micro-bet on Capsules, despite just 0.18% share, adds optionality with 772.80% year-over-year growth and 0.86% month-over-month growth, but the 81.42% year-over-year fall and 27.65% month-over-month drop in Pre-Roll indicate pruning rather than expansion. Net effect: maintaining a 10th-place Vapor Pens position in Missouri while lifting average price 2.39% year over year sets a positioning focused on premiumized inhalables, with limited hedge from ingestibles unless Edible stabilizes.
Competitive Landscape
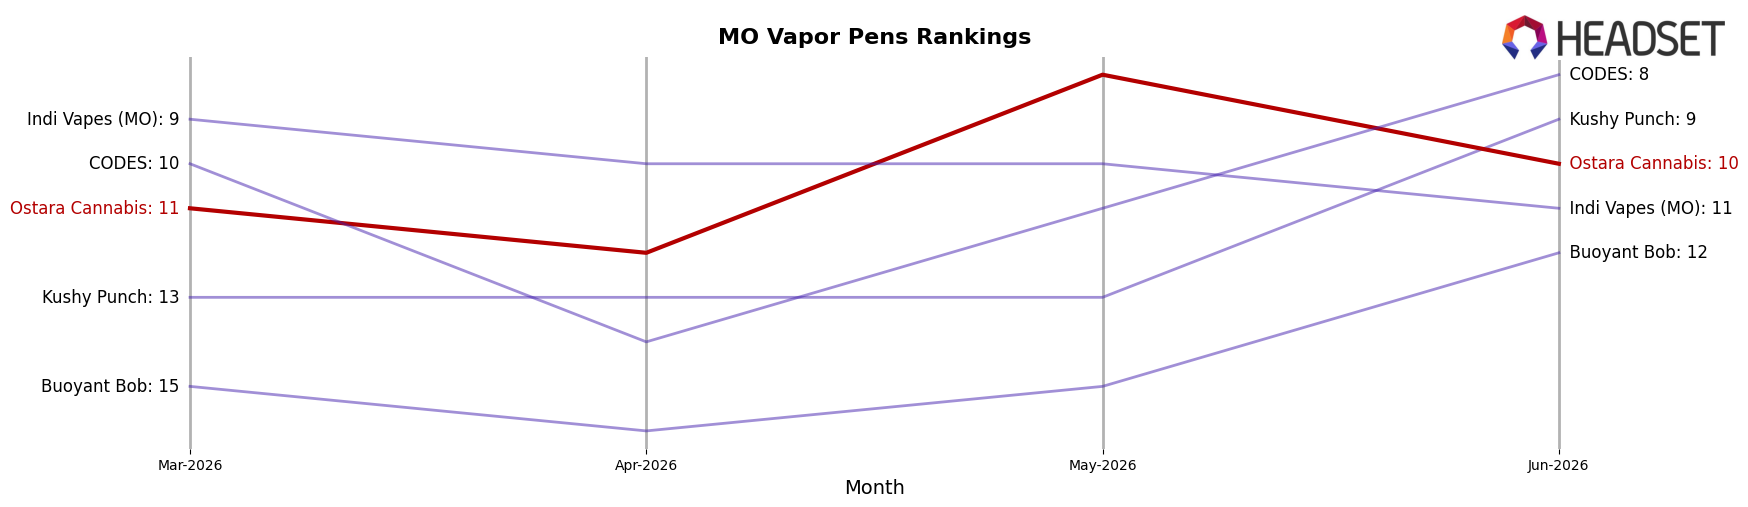
Ostara Cannabis sits at rank #10 in MO Vapor Pens in June 2026, improving 3 positions from #13 year over year and edging up 1 spot from #11 in March 2026, while still trailing its peak of #7 last reached in September 2024; meanwhile, Good Day Farm climbed from #10 to #2 as its sales rose 78.8% year over year and Galactic advanced from #5 to #3 alongside a 51.7% sales lift, indicating that Ostara’s modest rank gains are lagging competitors’ faster upward moves and implying the current trajectory points to share defense rather than a return to the prior top-7 range without a step-change in velocity.
Notable Products
THC/CBG 1:1 Rise Variety Sour Gummies 10-Pack (100mg THC, 100mg CBG) posted the standout move in June 2026 with a +14.3% month-over-month increase and held rank 2, while Sour Variety Gummies 10-Pack (100mg) slipped -3.0% and sat at rank 1. Five of the top six products are Edibles, and four Edibles in ranks 1–4 all posted negative month-over-month changes between -2.4% and -4.8%, which contrasts with the +14.3% rise of the functional CBG blend and implies a tilt toward effect-labeled formulations despite broad Edible softness. Gold Super High Dose Variety Sour Gummies 25-Pack (750mg) dropped -4.8% at rank 4 against $101,829 in sales, which, paired with the -2.4% decline for Gold Variety High Dose Gummies 10-Pack (200mg) at rank 3, indicates dose-led lines are plateauing while balanced minor-cannabinoid SKUs gather momentum.
Top Selling Cannabis Brands
Data for this report comes from real-time sales reporting by participating cannabis retailers via their point-of-sale systems, which are linked up with Headset’s business intelligence software. Headset’s data is very reliable, as it comes digitally direct from our partner retailers. However, the potential does exist for misreporting in the instance of duplicates, incorrectly classified products, inaccurate entry of products into point-of-sale systems, or even simple human error at the point of purchase. Thus, there is a slight margin of error to consider. Brands listed on this page are ranked in the top twenty within the market and product category by total retail sales volume.

