.svg)

Sep-2026
Sales
Trend
6-Month
Product Count
SKUs
Avg Price
YoY Sales Change
YoY Price Change


Where to Buy
Honu is stocked at 171 licensed dispensaries across Washington and Oregon, 167 of them in Washington, with the deepest coverage in Olympia, Seattle, Spokane, Vancouver, and Tacoma. Search by ZIP code or city below to find the closest one, or filter by product type if you are after a specific format.
Market Insights Snapshot
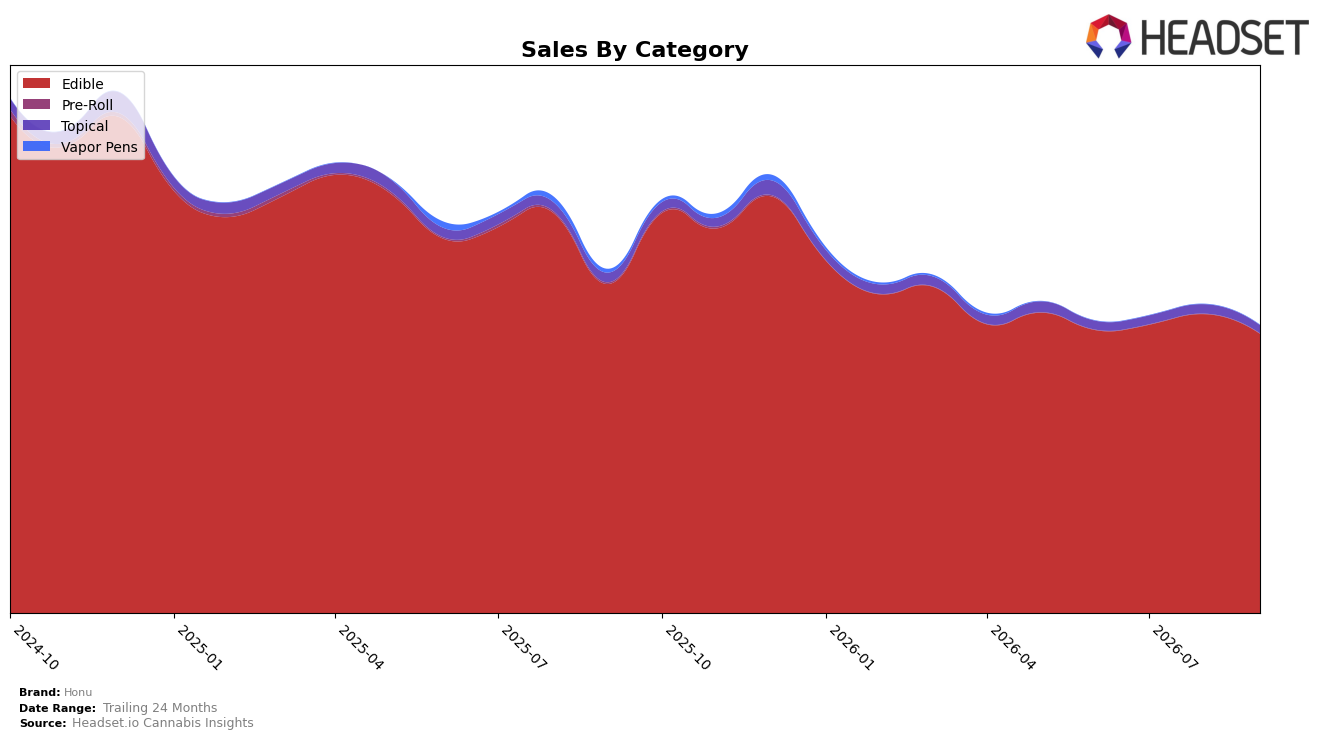
In September 2026, Honu concentrated 97.28% of sales in Edible with a -15.15% year-over-year decline and a -6.59% month-over-month drop, while Topical held 2.72% share with a -15.26% year-over-year change and a -13.27% month-over-month slide. The overall brand sales moved -16.29% year-over-year alongside a -3.05% average price change, and Edible ranked 17 in Washington, indicating category density that narrows diversification despite a lower average price of $14.58.
The mix shift implies Honu is tethered to Edible demand cycles, as a 97.28% reliance amplifies exposure when Edible declines -6.59% month-over-month and -15.15% year-over-year, while the smaller Topical base shrinks faster at -13.27% month-over-month and -15.26% year-over-year. Sitting at rank 17 in Washington with a -3.05% price move suggests price adjustments are not offsetting volume pressure, so maintaining share in Edible requires either recapturing velocity within the 97% core or reallocating toward adjacencies where a 2.72% share can compound without diluting margin dynamics.
Competitive Landscape
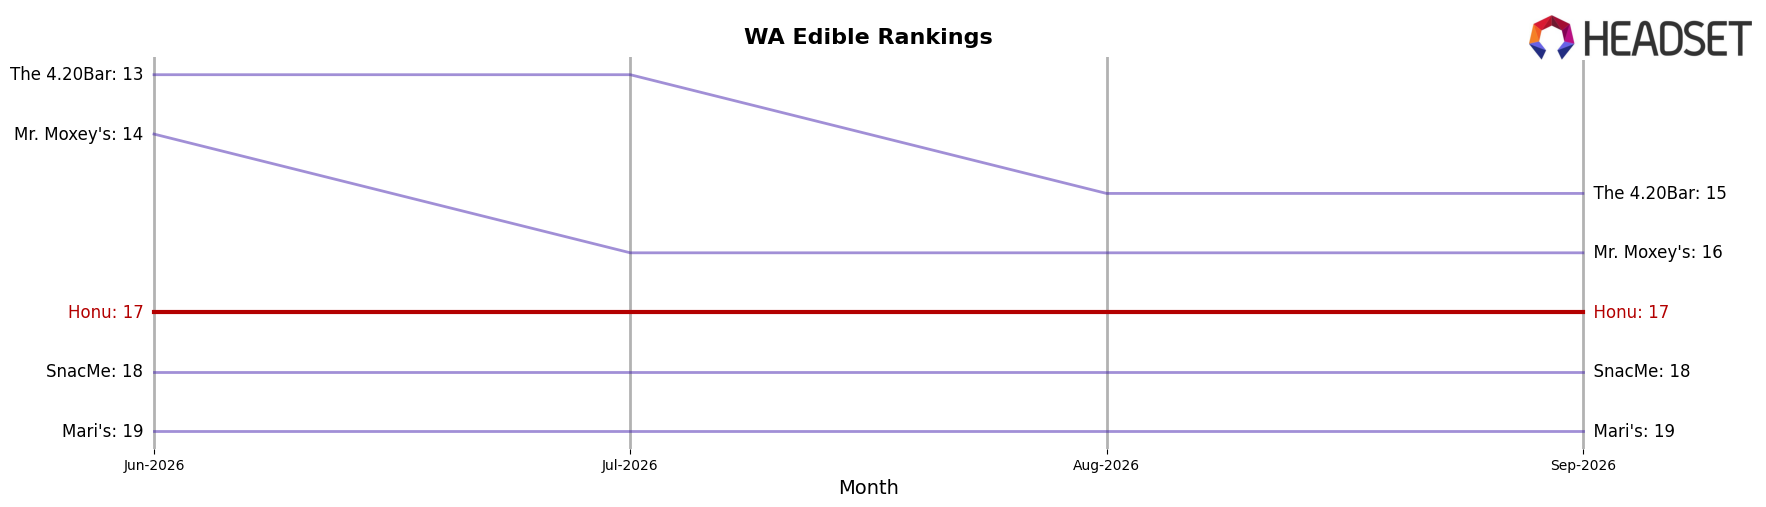
Honu sits at rank #17 in WA Edible in September 2026, down 1 position year over year from #16, and unchanged versus June 2026 at #17, while its peak of #14 in December 2024 marks a 3-rank slide from that high; meanwhile, Wyld holds #1 with a 0-rank YoY change and 6.0% YoY sales growth, and Green Revolution remains #2 with a 0-rank YoY change but a -3.1% YoY sales decline, indicating Honu’s flat three-month position and slight YoY slippage imply a stalled trajectory that risks entrenchment in the mid-teens unless a catalyst reverses the drift away from its December 2024 peak.
Notable Products
Indica Caramel Chocolate 10-Pack (100mg) posted the steepest drop at -22.2% MoM and fell to rank 5, while category leader Indica Peanut Butter Cups Chocolate 10-Pack (100mg) slipped -11.7% at rank 1; this divergence signals cannibalization risk within Indica sweets as price or pack-size preferences shift. Gimme Sa'More! Treats 10-Pack (100mg) inched up 3.5% at rank 2, but Indica Milk Chocolate Turtle 10-Pack (100mg) declined -7.5% at rank 3, with eight of the top ten SKUs concentrated in Edible chocolates, implying portfolio overexposure to a single form factor despite mixed momentum. The only double-digit MoM riser was Indica Peanut Butter Cups (100mg) at +27.9% and rank 8, a smaller-pack variant that may be trading customers down even as the 10-Pack leader holds the top spot at $24,620, pointing to value-seeking behavior.
Top Selling Cannabis Brands






Data for this report comes from real-time sales reporting by participating cannabis retailers via their point-of-sale systems, which are linked up with Headset’s business intelligence software. Headset’s data is very reliable, as it comes digitally direct from our partner retailers. However, the potential does exist for misreporting in the instance of duplicates, incorrectly classified products, inaccurate entry of products into point-of-sale systems, or even simple human error at the point of purchase. Thus, there is a slight margin of error to consider. Brands listed on this page are ranked in the top twenty within the market and product category by total retail sales volume.

