.svg)

Aug-2026
Sales
Trend
6-Month
Product Count
SKUs
Avg Price
YoY Sales Change
YoY Price Change


Where to Buy
The 4.20Bar is stocked at 131 licensed dispensaries across Washington, with the deepest coverage in Seattle, Vancouver, Tacoma, Spokane, and Bellingham. Search by ZIP code or city below to find the closest one, or filter by product type if you are after a specific format.
Market Insights Snapshot
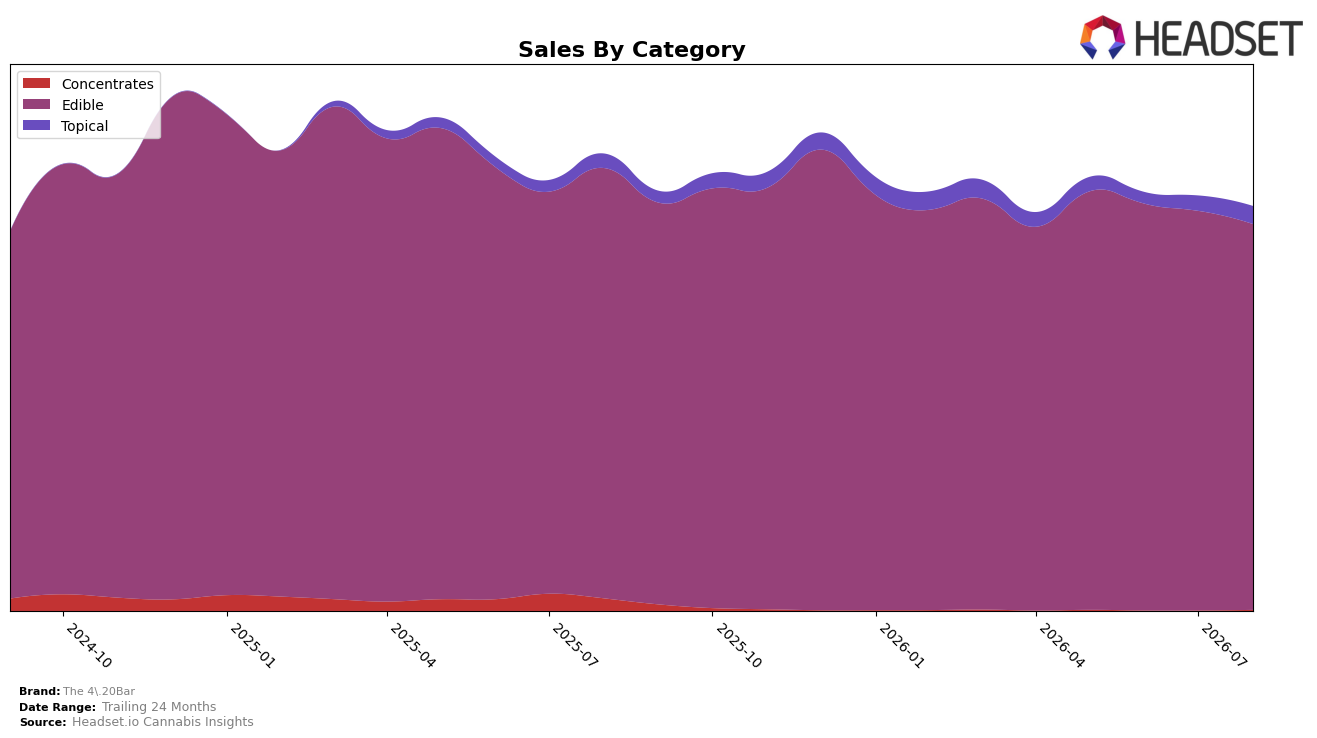
The 4.20Bar concentrated 95.49% of sales in Edible during August 2026, down 3.46% month over month and down 10.35% year over year, while Topical rose to 4.37% share with an 18.02% MoM increase and a 25.33% YoY increase; Concentrates slipped to 0.14% share with a 95.19% YoY decline and no reported MoM change. Average price declined 0.19% YoY to $14.67 even as the brand’s overall sales fell 11.51% YoY, and within Edible the average price sat at $14.50 versus $19.68 in Topical. This pattern implies The 4.20Bar is increasingly reliant on Edible despite shrinking velocity, while an expanding Topical niche is becoming the only growth vector, setting up a need to rebalance mix to offset Edible drag.
With Edible ranked 14 in Washington, the 3.46% MoM contraction in its core category contrasts with an 18.02% MoM expansion in Topical, and the 25.33% YoY Topical rise partially offsets the 10.35% YoY Edible decline. The 24‑month brand sales change of -4.26% against an 11.51% YoY drop indicates recent acceleration of headwinds concentrated in Edible mix, while Topical’s higher average price of $19.68 versus $14.50 in Edible suggests margin headroom if mix shifts continue. Taken together, the brand’s positioning is tilting toward value in Edible while opportunistically building a higher-priced Topical foothold, implying that share stability will depend on converting Topical’s growth into a larger share without further eroding Edible rank.
Competitive Landscape
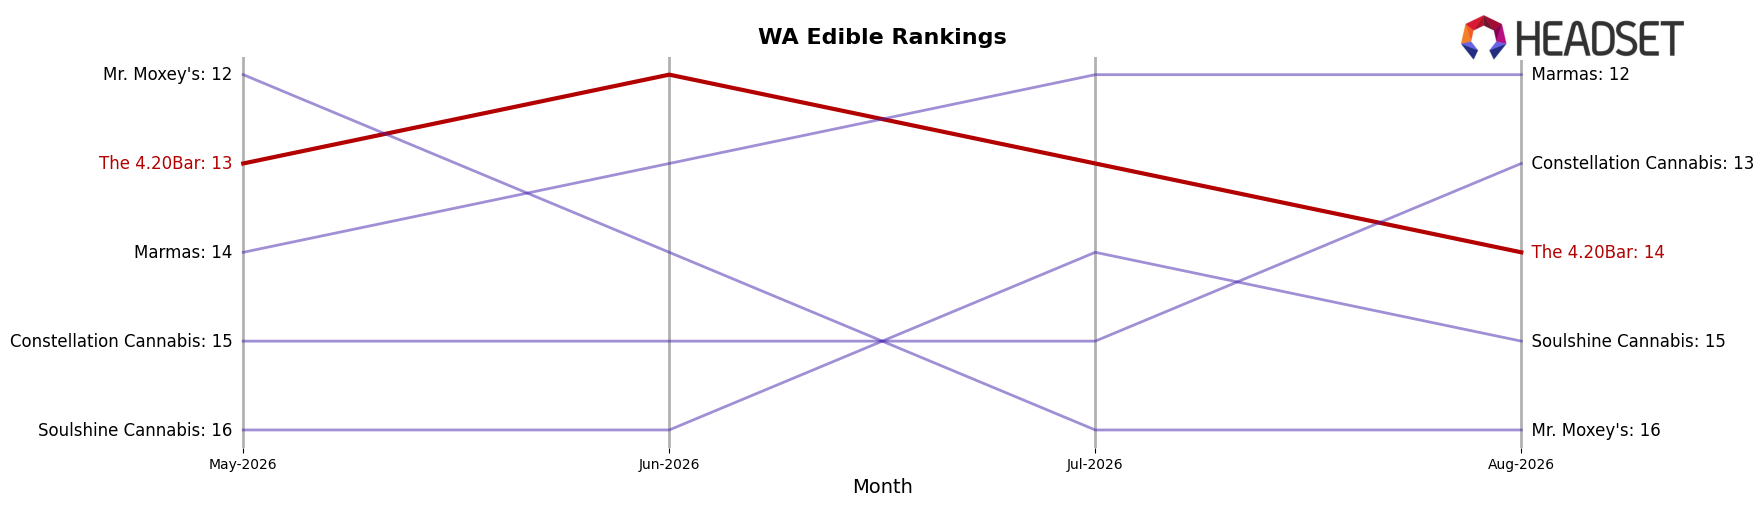
The 4.20Bar sits at rank 14 in WA Edible for August 2026, unchanged from rank 14 in August 2025, after slipping 1 position from rank 13 in May 2026 to rank 14 in August 2026 while peaking at rank 12 in June 2026; meanwhile, Wyld held rank 1 year over year with sales up 5.1%, and Craft Elixirs stayed at rank 5 with sales down 13.9%, indicating The 4.20Bar’s flat YoY rank alongside mixed competitor momentum points to a stable but stalled position where minor mid-year gains did not convert into sustained share capture.
Notable Products
Minis - CBG/CBC/CBD/THC 1:1:1:1 Milk Chocolate Hemp Crunch Bites 10-Pack (100mg CBG, 100mg CBC, 100mg CBD, 100mg THC) fell 25.3% month over month to rank 8, while the leader Minis - CBG/CBC/CBD/THC 1:1:1:1 Dark Chocolate Sea Salt Bites 10-Pack (100mg CBG, 100mg CBC, 100mg CBD, 100mg THC) slid 13.5% but held rank 1. In contrast, Minis - CBG/CBC/CBD/THC 1:1:1:1 Milk Chocolate Bites 10-Pack (100mg CBG, 100mg CBC, 100mg CBD, 100mg THC) grew 8.3% at rank 3 as classic Milk Chocolate Bites 10-Pack (100mg) declined 14.5% at rank 6. Eight of the top ten are Minis Edible SKUs, concentrating sales into small-format chocolate where multi-cannabinoid blends outperformed single-cannabinoid or plain variants by both positive growth at ranks 3 and 5 and shallower declines than the double-digit drops at ranks 6 and 9. The pattern implies The 4.20Bar is pivoting toward differentiated 1:1:1:1 and 2:2:1 formulations within Minis to defend top rankings despite softness in legacy chocolate profiles, suggesting mix-led resilience rather than price-led expansion.
Top Selling Cannabis Brands






Data for this report comes from real-time sales reporting by participating cannabis retailers via their point-of-sale systems, which are linked up with Headset’s business intelligence software. Headset’s data is very reliable, as it comes digitally direct from our partner retailers. However, the potential does exist for misreporting in the instance of duplicates, incorrectly classified products, inaccurate entry of products into point-of-sale systems, or even simple human error at the point of purchase. Thus, there is a slight margin of error to consider. Brands listed on this page are ranked in the top twenty within the market and product category by total retail sales volume.

