Jun-2026
Sales
Trend
6-Month
Product Count
SKUs
Avg Price
YoY Sales Change
YoY Price Change
Market Insights Snapshot
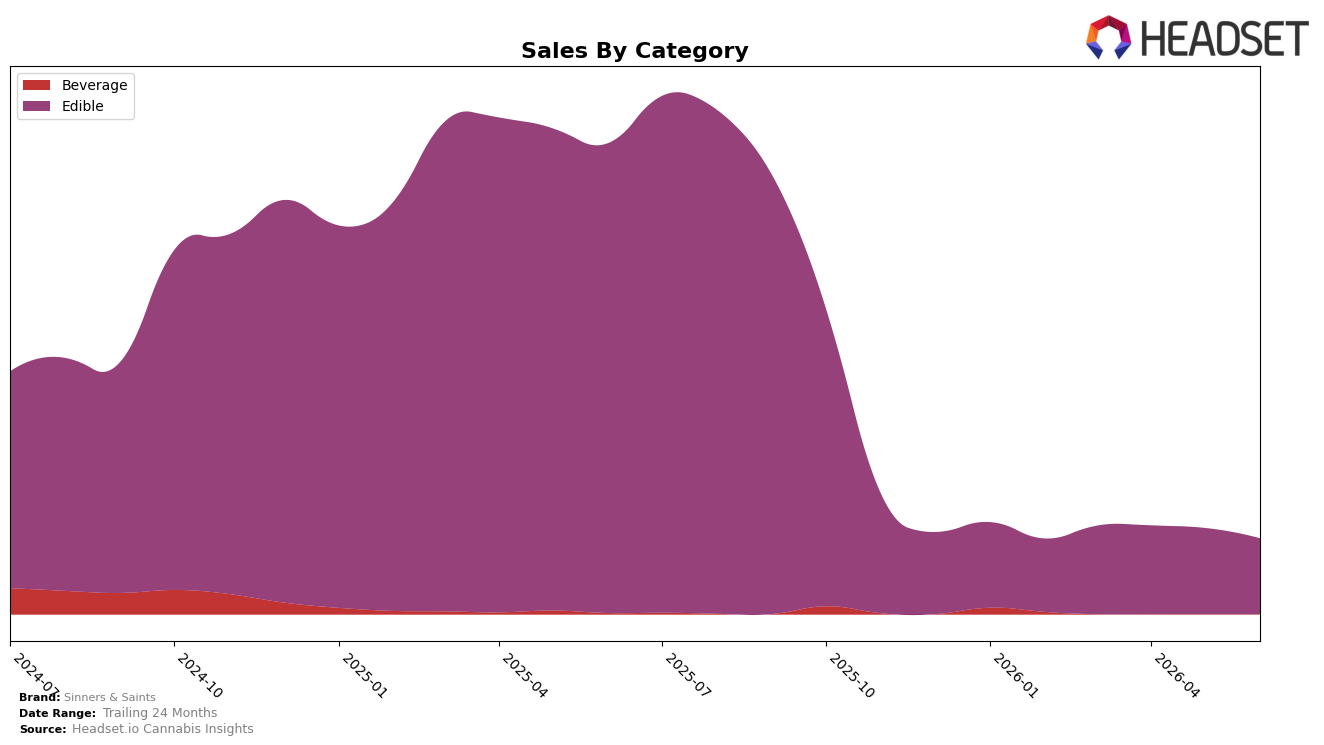
In June 2026, Sinners & Saints concentrated entirely in Edible, with category share at 100.0% while brand sales declined 83.93% year over year and fell 12.01% month over month; average price decreased 3.41% YoY to $14.89. Within Washington Edible, the brand held rank 30 as of June 2026, indicating a downshift relative to broader market tiers; the combination of an 83.97% brand-level YoY decline and a category-only mix at 100.0% implies the portfolio has narrowed to a single format as volumes contract faster than pricing.
The consolidation into a 100.0% Edible mix alongside a 12.01% MoM sales drop and a 3.41% YoY price decrease signals a value-seeking posture that risks compressing premium positioning while not expanding reach into other categories. Holding rank 30 in June 2026 within Washington Edible, combined with an 83.93% YoY sales decline and a 65.38% 24‑month reduction, implies the brand is competing primarily on price within a crowded mid-to-lower tier, and that diversification beyond Edible or targeted SKU rationalization within Edible is now a prerequisite for stabilizing share.
Competitive Landscape
Sinners & Saints sits at rank #30 in WA Edible in June 2026, down 14 positions year over year from #16, and 2 spots lower than March 2026 when it was #28; compared with its peak at #15 in August 2025, the brand has ceded 15 places as top-tier players consolidated. Competitors have mostly held or advanced: Wyld held #1 year over year with a 7.3% YoY sales lift, while Green Revolution held #2 with a 17.5% YoY increase, indicating that category gains are accruing to incumbents rather than mid-pack challengers; by contrast, Hot Sugar stayed at #3 despite a 1.8% YoY decline, signaling that rank stability at the top persists even with mixed growth. The pattern implies Sinners & Saints’ downward rank trajectory from #16 to #30 alongside stable top-5 positions suggests share compression concentrated in the middle of the ranking rather than broad category disruption.

Notable Products
The steepest decline set the tone in June 2026 as CBN/CBD/THC 2:2:1 Blue Raspberry Gummies 10-Pack (200mg CBN, 200mg CBD, 100mg THC) fell 22.1% to rank 1 while the CBG/THC 2:1 Sour Cherry Gummies 10-Pack (200mg CBG, 100mg THC) slid 13.3% at rank 5, signaling that top placement no longer guarantees momentum. In contrast, CBN/CBD/THC 2:2:1 Pomegranate Acai Gummies 10-Pack (200mg CBN, 200mg CBD, 100mg THC) rose 42.5% at rank 8 while the CDB/THC 1:1 Blue Raspberry Gummies 10-Pack (100mg CBD, 100mg THC) dropped 18.2% at rank 6, a divergence that points to consumer tilt toward multi-cannabinoid CBN-led blends over standard 1:1s. Four of the top ten are 2:2:1 CBN/CBD/THC or 1:1:1:1 multi-cannabinoid SKUs clustered between ranks 1 and 4 with MoM shifts ranging from -22.1% to +7.1%, implying assortment strength is concentrated in complex ratios rather than single-pair formulas. Taken together, the mix indicates Sinners & Saints is pivoting toward differentiated multi-cannabinoid gummies, trading some volume volatility at the top for a portfolio that can convert niche demand even when flagship units post a $10,489 month under pressure.
Top Selling Cannabis Brands
Data for this report comes from real-time sales reporting by participating cannabis retailers via their point-of-sale systems, which are linked up with Headset’s business intelligence software. Headset’s data is very reliable, as it comes digitally direct from our partner retailers. However, the potential does exist for misreporting in the instance of duplicates, incorrectly classified products, inaccurate entry of products into point-of-sale systems, or even simple human error at the point of purchase. Thus, there is a slight margin of error to consider. Brands listed on this page are ranked in the top twenty within the market and product category by total retail sales volume.

