Jun-2026
Sales
Trend
6-Month
Product Count
SKUs
Avg Price
YoY Sales Change
YoY Price Change
Market Insights Snapshot
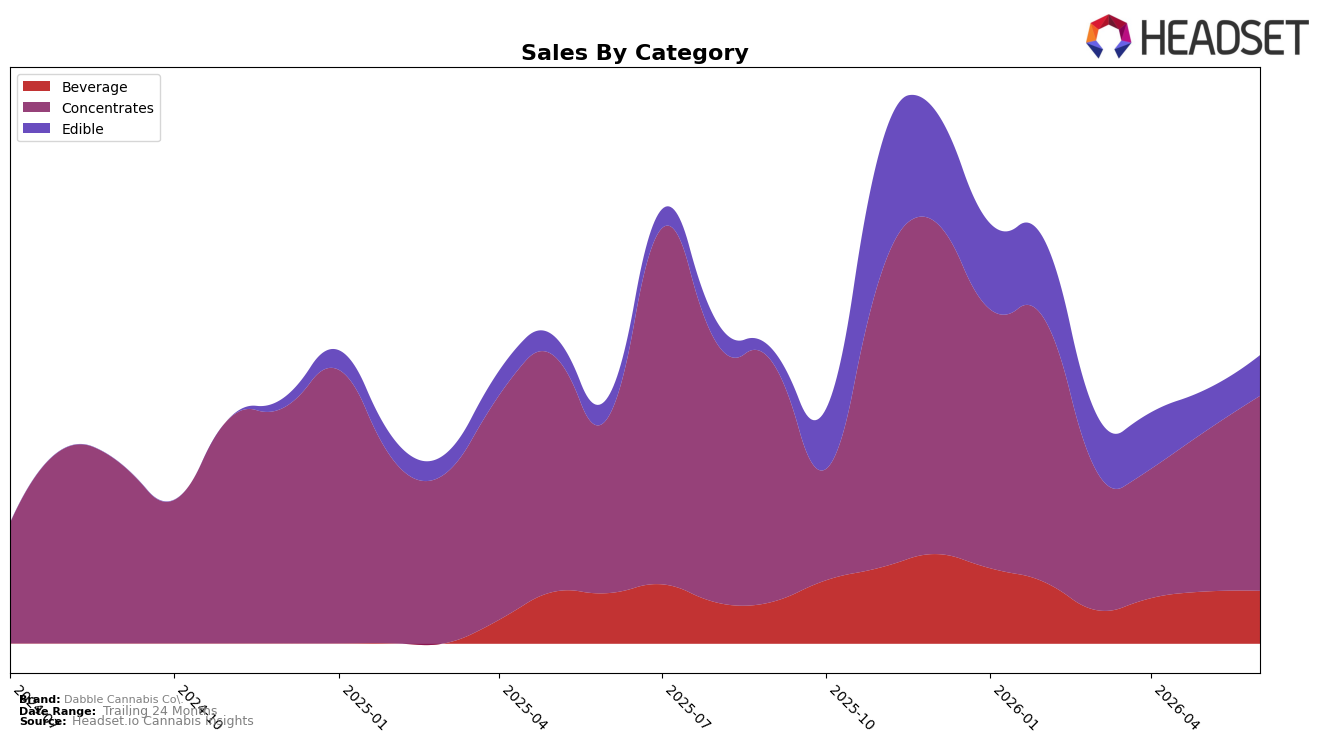
In June 2026, Dabble Cannabis Co. concentrated 67.66% of sales in Concentrates with year-over-year growth of 10.82% and month-over-month growth of 22.09%, while Beverage held 18.30% with 4.54% YoY and 1.39% MoM, and Edible reached 14.05% with 100.02% YoY but -2.46% MoM. The brand’s overall sales grew 16.85% YoY as average price rose 8.96% YoY to $24.55, pointing to mix-driven uplift rather than pure volume. With Concentrates ranked 4th in British Columbia and commanding two-thirds of the mix versus Edible’s smaller but triple-digit YoY surge, the pattern implies a reliance on Concentrates for near-term momentum while Edible serves as the fast-scaling adjacently; the thesis is that June 2026 marked a pivot toward a two-pillar portfolio where short-term gains ride a 22.09% MoM spike in Concentrates and medium-term headroom comes from Edible’s 100.02% YoY expansion despite its MoM dip.
Positioning-wise, the 67.66% share in Concentrates coupled with a rank of 4 in British Columbia signals a specialist stance anchored in high-velocity dabbable formats, while Beverage’s 18.30% share with only 1.39% MoM growth indicates a stabilizer role rather than a growth wedge. The mix suggests pricing power concentrated in premium extracts (53.58 average price in Concentrates) supporting the 8.96% YoY rise in overall average price as Edible’s 100.02% YoY growth broadens household reach; the thesis is that Dabble Cannabis Co. is positioned to defend a top-5 Concentrates slot while selectively scaling Edible to diversify away from category cyclicality, using Beverage as a steady-but-slower channel that smooths month-to-month variance.
Competitive Landscape
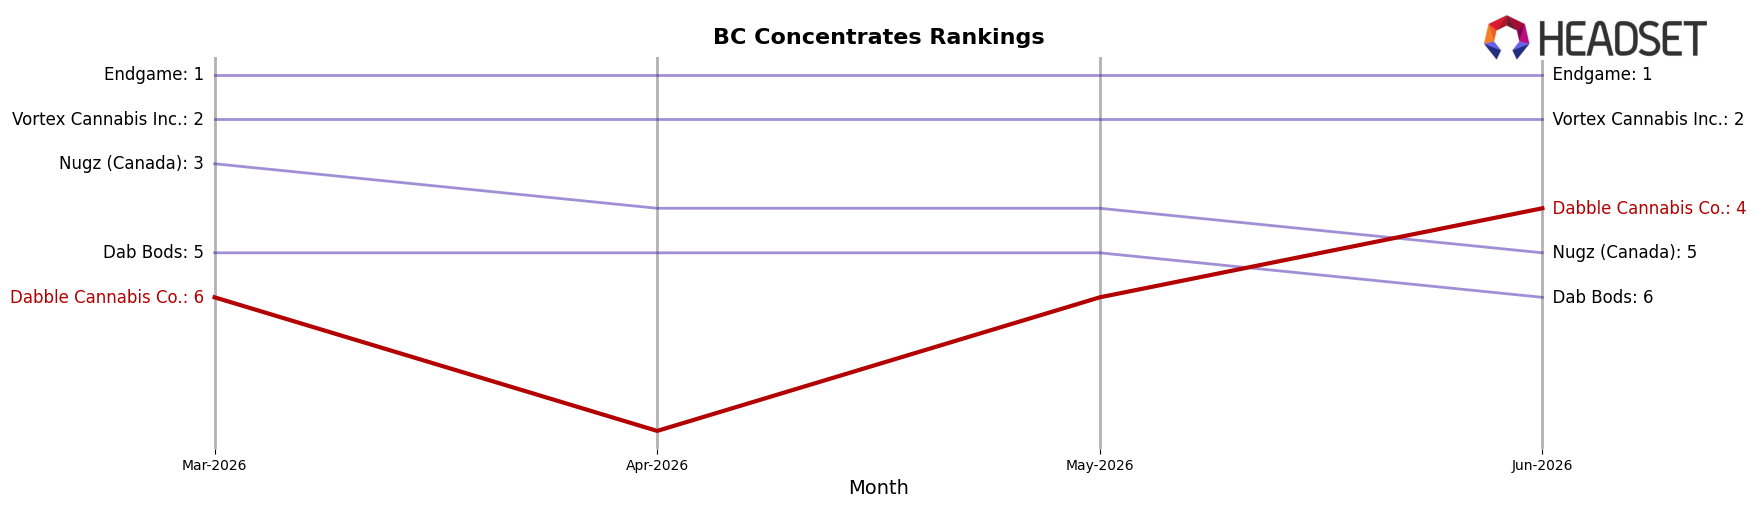
Dabble Cannabis Co. sits at rank #4 in BC Concentrates in June 2026, improving 1 position from #5 year over year, and rising 2 spots from #6 in March 2026; however, it remains 1 place below its peak at #3 in February 2026 and trails two brands that shifted more sharply, as BoxHot jumped from #10 to #3 while Endgame held at #1 with a 13.8% year-over-year sales gain. The competitive middle is compressing: Dabble Cannabis Co. is 1 rank behind #3 while Nugz (Canada) climbed 10 positions to #5 on 145.2% sales growth, and Vortex Cannabis Inc. sits at #2 despite a 38.2% sales decline; this mix of upward and downward moves indicates Dabble Cannabis Co.’s modest rank gains are at risk of being outpaced by faster movers, implying the trajectory points to a near-term fight to defend #4 rather than a clear path back to #3.
Notable Products
Dabble Cannabis Co.'s Dabbleberry Live Rosin (1g) posted the largest month-over-month surge at +129.96% to rank 3, while Strawberry Jam Raspberry Sparkling Lemonade (10mg THC, 355ml) fell -11.68% to rank 2, signaling share migration from beverages to concentrates. Blackberry Sparkling Lemonade (10mg THC, 12oz, 355ml) rose +10.66% at rank 1 even as Mexicola Live Hash Rosin (1g) declined -46.51% at rank 8, indicating consumer preference is consolidating around a single leading beverage and a breakout rosin SKU. Four of the top ten are Concentrates SKUs, and two Edible items posted double-digit declines of -23.36% and -42.21%, implying the product mix is tilting toward premium live rosin while secondary edibles and mid-tier rosins lose momentum. The Milk Chocolate Waffle Cone 2-Pack (10mg) climbed +77.68% to rank 4 against a -3.92% dip for the Strawberry Jam Gummies 10-Pack (100mg), suggesting edibles growth is concentrated in novelty formats rather than volume packs, pointing the commercial focus toward fewer hero SKUs anchored by live rosin and a single flagship beverage.
Top Selling Cannabis Brands
Data for this report comes from real-time sales reporting by participating cannabis retailers via their point-of-sale systems, which are linked up with Headset’s business intelligence software. Headset’s data is very reliable, as it comes digitally direct from our partner retailers. However, the potential does exist for misreporting in the instance of duplicates, incorrectly classified products, inaccurate entry of products into point-of-sale systems, or even simple human error at the point of purchase. Thus, there is a slight margin of error to consider. Brands listed on this page are ranked in the top twenty within the market and product category by total retail sales volume.

